
The feature provides analytical dashboards and visualization capabilities that help you manage core aspects of the business’s operations, without needing third-party business intelligence solutions.
As well as supplying you with a business management system that acts as a system of insight, it also empowers SYSPRO users to easily create, customize and deploy dashboards and visualizations anywhere in SYSPRO.
lets you transform your current data into visualizations and dashboards, providing decision making analysis to business users and functional roles.

Exploring
The SYSPRO Embedded Analytics module form part of SYSPRO's Enterprise Reporting capabilities and empowers you to create, manage and deploy both operational and analytical dashboards into SYSPRO. This is achieved using the SYSPRO Web View technologies and is based on SYSPRO's Business Activity Queries (for input data).
Therefore, provides the following functionality:
-
Engaging and intuitive dashboards:
Understand complex data and work more efficiently directly within SYSPRO.
-
Real-time streaming and data playback with the innovative data DVR:
Stream both real-time and historical data to dashboards to visually analyze changes in real-time and over time.
-
Custom Visualizations:
Build an interactive experience with custom visualizations for more clarity and deeper insights into your data.
-
Fully Interactive Visualizations:
-
Drill down or across to reveal more answers from your data.
-
Explore trends over time and discover outliers and anomalies.
-
Get to the details quickly with just a few clicks to see raw data.
-
-
Template Dashboard Packs:
Experience out-of-the-box analytics within SYSPRO to enable immediate time to value and provide examples for learning how to create dashboards for embedding within SYSPRO.
-
Dashboard migration capabilities between SYSPRO instances:
Reduce the complexity and errors associated with dashboard migration by eliminating the manual processes involved in transferring dashboards, especially those with dependencies on Business Activity Queries.
-
Improved operation visibility and analytical capabilities:
provides you with the answers you need, within the application you’re using; thereby enabling faster awareness and improved decision making in response to operational changes.
-
Cost savings:
Centralized and embedded data analytics without the requirement for investment in third party solutions.
-
Easy to use:
Built-in dashboard design and embedding experience (with little to no requirement to learn coding or reliance on development skills) means you can design and maintain your own data connections, visualizations and analytical dashboards quickly and easily.
-
Reliable security:
integrates with existing SYSPRO security to provide a frictionless authentication experience, while maintaining granular control with row, column and object level security.
-
Reduced risk:
Associated with disparate reporting and analytical solutions and improved resilience through centralization of reporting.
comprises of the following components:
-
Deployment Service Installation
-
Designer Application (i.e. Embedded Analytics Designer) that comprises of:
-
Data Connection Manager
-
Data Source Manager (i.e. Creation and Transformation Tool)
-
Visualization Manager (i.e. widgets)
-
Dashboard designer and library Manager
-
Data Interrogation Features
-
-
Embedding Analytics: Web Card (for deployment though the Visual Designer into SYSPRO web views)
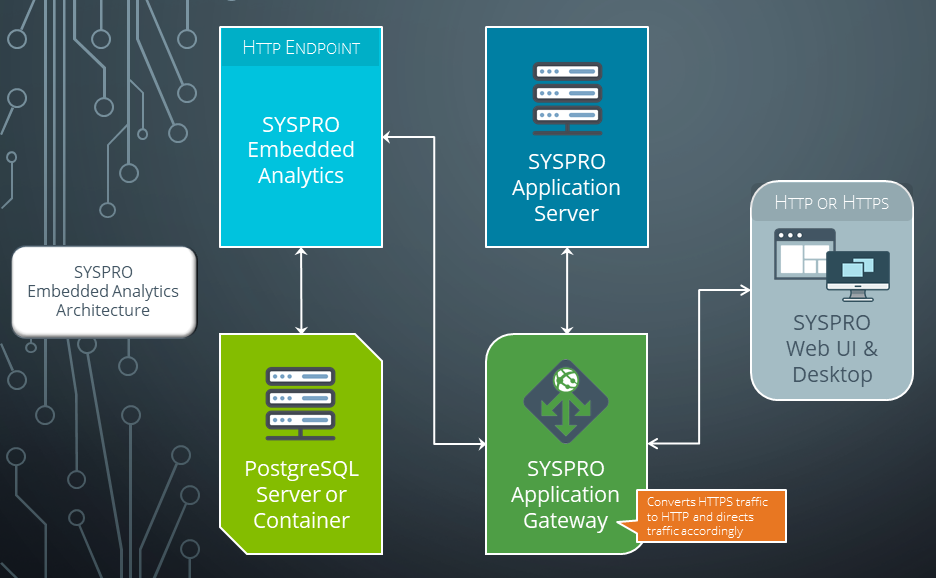
This diagram depicts the components and services used within :
-
When a SYSPRO operator accesses the module, they are directed to the SYSPRO Application Gateway service. This includes activities such as:
-
Viewing dashboards
-
Designing dashboards
-
Configuring
-
Generating user access tokens to authenticate users
-
Querying existing dashboards when designing user interfaces
-
-
The SYSPRO Application Gateway performs two functions:
-
It converts any HTTPS traffic to HTTP and then directs the user through to .
Note that an SSL certificate is required if converting from HTTPS.
-
It abstracts away the actual endpoint for to ensure security (i.e. the endpoint is not visible outside of the organization).
-
The programs related to this feature are accessed from the SYSPRO Ribbon bar:
-
Program List > Embedded Analytics
SYSPRO Business Activity Queries are SQL views that are created in the relevant company databases and (because they are defined in SYSPRO) are recognized as data sources. They provide a view into the business data commonly used during the typical business management process. The queries are built and secured in the core ERP system and then surfaced to users via their enterprise reporting and connectivity solutions.
An connection refers to the active connection with a smart connector that allows access to your data store.
This embodies the advanced capability of placing Dashboards into any SYSPRO program, which dynamically adjust their content, automatically refining displayed data in response to changes made to SYSPRO key fields or form values.
A Source configuration within is a bucketed collection of rows and columns pulled from a connected datastore (i.e. database). These collections and their cached aggregated results are used to drive the visual creation process, while simultaneously helping to build data-driven insights (i.e. dashboards).
A visualization (or visual or widget) is a single, reusable visual that’s driven by one of your defined sources. It's purpose is to be used as a component within dashboards.
Starting
To use this feature, the following technology prerequisites are required:
-
SYSPRO Application Gateway service
-
PostgreSQL 12 (Configured server-side)
-
Microsoft Edge WebView2
This controller must installed on the SYSPRO Desktop Client for SYSPRO users to be able to design and deploy dashboards.
This is built into the Client install from SYSPRO 8 2022 onwards.
Recommendations:
We recommend using Windows Server 2019 or higher, with at least 16GB RAM and 4 cores.
To use this feature, the following module(s) must be installed according to the terms of your software license agreement:
-
SYSPRO Embedded Analytics
In addition, you must have licensed designer seats configured within your SYSPRO license.
Additionally, to gain the most benefit from this feature, you should ideally be utilizing the following modules:
-
System Administration
-
Sales Orders
-
Purchase Orders
-
Inventory Control
-
Work in Progress
-
General Ledger
For all deployments, a 64-bit operating system is required. The Server also uses Java and PostgreSQL. Ensure that the appropriate versions of these tools are used in the deployment of in your operating environment.
The following operating systems and support services (with the corresponding minimum versions) are required:
-
Windows Server 2012 R2, 2016, 2019
-
PostgreSQL 12
-
Java 11.0.5 (or later)
The following server specifications are recommended:
-
64 GB RAM (minimum is 16 GB)
-
500 GB disk space
-
16 cores
To maximize the operational efficiency of , you must take several factors into account to appropriately size the server in your operating environment:
-
Concurrent user count
This is the most important parameter that increases the load on the system. Concurrent users represent only a portion of the total number of available users in an organization who may access the server at the same time. A single-node deployment can handle up to 100 concurrent users with acceptable performance. If you need more than 100 users, you should consider using several nodes.
-
Entity count (users, data sources, visuals, dashboards, etc.)
The number of entities in the system doesn’t impact the performance if you have up to 1000 instances of each entity type. Allocate more resources than shown in the table below to support more than 1000 instances of each entity type.
-
Data cardinality
The amount of data processed doesn't affect the performance of , because it pushes the work for the queries to your data stores and relies on their performance. However, if you have large data sets and want to group the data by a high-cardinality field, you should increase the resource allocation for the query engine.
-
High availability (HA)
If your environment is an HA environment, sizing requirements may double if each microservice is running on multiple instances.
The table below reviews the recommended sizing guidelines for a single-node server. The specifications are suggested starting points and only reflect the minimum estimates. Sizing for performance is impacted by many other factors outside these, such as where resides, the types of data sources you are using, interactions between applications and data sources, etc.
The following sizing guidelines reflect testing of a single-node server with up to 1000 concurrent users, 400 data sources, 500 dashboards, and 6000 visuals.
| Concurrent Users | Hardware Requirements | Time Opening Dashboard (12 Visuals) | Web | Query Engine | Connector | PostgreSQL Metadata Store |
|---|---|---|---|---|---|---|
|
Up to 5 |
Memory: 8 GB CPU: 8 core Disk: 100 GB |
17 seconds | Memory: 2 GB | Memory: 1 GB | Memory: 512 MB |
Memory: 512 MB |
|
Up to 20 |
Memory: 8 GB CPU: 8 core Disk: 100 GB |
19 seconds | Memory: 2 GB | Memory: 1 GB | Memory: 512 MB |
Memory: 512 MB |
|
Up to 100 |
Memory: 16 GB CPU: 16 core Disk: 100 GB |
26 seconds |
Memory: 4 GB Configuration Settings: spring.datasource.hikari.maximum-pool-size = 50 |
Memory: 3 GB | Memory: 1 GB |
Memory: 1 GB |
|
Up to 1000 |
Memory: 16 GB CPU: 16 core Disk: 100 GB |
4 minutes |
Memory: 5 GB Configuration Settings: spring.datasource.hikari.maximum-pool-size = 150 jetty.threadPool.maxThreads = 1000 query.engine.service.maxConcurrentRequests = 1000 |
Memory: 4 GB | Memory: 1 GB |
Memory: 1 GB |
uses a packaged PostgreSQL v12 database instance to store its metadata and we strongly recommend using this instance due to the specific configuration and version employed.
The following table lists the ports you must consider when installing or upgrading .
| Feature | Microservice | Default Port | Required? | Notes |
|---|---|---|---|---|
|
server |
zoomdata |
8080 |
ü |
|
|
server |
zoomdata |
8443, 443 |
û |
Only required if you use HTTPS. |
|
Consul |
zoomdata-consul |
8500 |
ü |
|
|
Query engine |
zoomdata-query-engine |
5580 |
ü |
|
|
Appropriate Connectors |
zoomdata-edc-<connector> |
varies |
ü |
Only the ports for the connectors to the data stores you will use, are required. |
|
Data Writer |
zoomdata-data-writer |
8081 |
û |
Only required if you use flat files or upload API sources. |
|
Screenshot Service |
zoomdata-screenshot-service
|
8083 |
û |
Only required if you schedule dashboard reports. |
|
PostgreSQL metadata repository |
zoomdata-postgres |
5432 |
ü |
|
recommends installing the Network Time Protocol daemon (NTPD) to allow for time synchronization of networked servers to Coordinated Universal Time (UTC).
To use this feature, the following setup options must be configured:
Setup Options
Setup Options > System Setup > Connectivity
-
Application Gateway service settings
This lets you connect to the SYSPRO Application Gateway service.
-
:
-
Embedded Analytics enabled
This lets you activate or deactivate the usage of the feature.
-
Analytics Endpoint
This lets you connect to .
-
Configure
This configures your environment.
-
Operator Maintenance
SYSPRO Ribbon bar > Setup > Operators
-
This enables the selected operator to access the following programs:
Disclaimer:
The following steps for installing PostgreSQL are accurate to the best of our knowledge at the time of publication. However, please be aware that PostgreSQL is third-party software and the software company may change their installation processes or user interface at any time.
Therefore, while we have made every effort to ensure that the information presented is up-to-date, its possible that the certain elements may become outdated in the future. We recommend that readers regularly check the PostgreSQL documentation for updates and changes to their installation process.
-
Download PostgreSQL 12:
-
Navigate to the following URL:
https://www.enterprisedb.com/downloads/postgres-postgresql-downloads
-
From the installer listing, locate the latest Version 12 (e.g. 12.14) and select the download icon within the Windows x86-64 column.
The postgresql-12.xx-x-windows-x64.exe install file (where xx-x indicates the selected version) is placed within your Downloads folder, unless you defined otherwise.
-
-
Install PostgreSQL 12:
During the install you will be prompted for a PostgreSQL Password and Port.
Ensure that you take note of these entries as they are required later during the install.
-
Launch the installer from the downloaded exe file.
-
From the Installation Directory window, define the installation directory by accepting the default path (or change to suit your requirements).
-
From the Select Components window, accept the default components enabled:
-
PostgreSQL Server
-
pgAdmin 4
-
Stack Builder
-
Command Line Tools
-
-
From the Data Directory window, accept the default pathing provided (or change to suit your requirements).
-
From the Password window, enter and confirm your preferred password. Make sure that there aren't any extra spaces within your entry.
Ensure that you take note of this password as it is required later during the install.
-
From the Port window, accept the default port provided as 5432 (or change to suit your requirements).
Ensure that you take note of this port number as it is required later during the install.
-
From the Advanced Options window, accept the default provided and select Next to proceed.
-
After reviewing the pre-installation summary, proceed with the install.
Upon completion, a confirmation screen is displayed and you are given the option to install the Stack Builder.
The Stack Builder is not needed as it has no relation to . It merely provides a graphical interface that simplifies the download and installation process for modules that complement the PostgreSQL installation.
Disable the Stack Builder install option and confirm to close the installation wizard.
-
-
Launch the SYSPRO Installer Application.
-
Once a connection is made to the SYSPRO Deployment Service, login using your InfoZone credentials.
If you are a partner or super-user, enter the applicable Customer ID for the customer being installed.
-
From the SYSPRO Installer Application home screen, select the SYSPRO ERP Software option.
-
From the Deployment Groups screen, select the relevant Deployment Group.
-
From the Release Selection screen, select the SYSPRO 8 2022 (or later) release.
-
From the Product Selection screen, select the SYSPRO Application Gateway service.
The SYSPRO Installer verifies your system against all prerequisites required for the products you select to install. Should any product fail a prerequisite check at this stage, the Prerequisites screen is displayed.
-
From the Review Product Parameters screen, review all parameters required for the service:
Parameter Description and considerations HTTP Port
Indicate if you want to use an HTTP port.
Default port number provided: 30800
Accept the default provided or change manually to match your preference.
Add HTTP port to firewall
For best practice, enable this option to ensure that the port number is added to your firewall.
HTTPS Port
Indicate if you want to use an HTTPS port.
Default port number provided: 30801
Accept the default provided or change manually to match your preference.
SSL certificate details are required when selecting this port type.
Add HTTPS port to firewall
For best practice, enable this option to ensure that the port number is added to your firewall.
Certificate Store
This indicates the SSL certificate store found against your system.
This field is read only and can't be changed.
Certificate Subject
Select the Browse icon to retrieve the relevant SSL certificate to use for running your web client.
This launches the Parameter Certificate Browser screen with the valid and current SSL certificates available under the default stores.
The selection defaults to the first item found in the Store list which subsequently loads the Subjects (also defaulting to the first item in the list).
From here you can browse for and select the applicable SSL certificate.
Certificate Subject Overwrite
This indicates the current SSL certificate subject, if the Overwrite Subject option was enabled within the Parameter Certificate Browser screen.
This field is read only and can't be changed.
Please enter the SYSPRO Gateway Read Only Authentication key
Enter a read-only authentication key for the SYSPRO Application Gateway service.
For example:
AppGateWayPass123
You can define any password, pass-phrase or secret for this authentication key, and once defined its stored in the Gateway’s configuration as a hashed value.
Ensure that you take note of this key as it is required later when configuring the gateway in the Setup Options program.
Please enter the SYSPRO Gateway Authentication key
Enter a value for the SYSPRO Application Gateway authentication key.
For example:
AppGatewayKey321
You can define any password, pass-phrase or secret for this authentication key, and once defined its stored in the Gateway’s configuration as a hashed value.
If you plan on installing the SYSPRO Embedded Analytics module:
Ensure that you take note of this key as it will be required during the install for , as well as within the Setup Options program when configuring your environment.
Destination Folder
Default provided: C:\Program Files\SYSPRO\SYSPRO Application Gateway
Accept the default provided or change manually to match your preference.
-
From the SYSPRO License Agreement screen, read and accept the license terms and conditions before continuing with the install.
-
A summary of all products to be installed is displayed for you to review.
Once you are satisfied with the list, continue by selecting the Begin Install button.
-
The Install Complete screen is displayed with a summary of all products installed.
When installing any service that requires a port number entry, ensure that you configure your firewall appropriately to allow access through your selected port(s).
-
Launch the SYSPRO Installer Application.
-
Once a connection is made to the SYSPRO Deployment Service, login using your InfoZone credentials.
If you are a partner or super-user, enter the applicable Customer ID for the customer being installed.
-
From the SYSPRO Installer home screen, select the SYSPRO Additional Software option.
-
From the Additional Software Packages screen, select the SYSPRO Embedded Analytics option.
-
The SYSPRO Embedded Analytics screen is displayed, indicating the files to be installed.
The SYSPRO Installer verifies your system against all prerequisites required for the products you select to install. Should any product fail a prerequisite check at this stage, the Prerequisites screen is displayed.
-
From the Review Product Parameters screen, review all parameters required for the product:
Parameter Description and considerations Do you want to upgrade the existing installation
This only applies if you have a prior version of installed.Enabling this option upgrades your existing product.
PostgreSQL Hostname
This indicates the name of the machine on which the PostgreSQL service is hosted.
For example:
localhost
PostgreSQL Port
This indicates the port on which the PostgreSQL service is running.
Default port number provided: 5432
Accept the default provided or change manually to match your preference.
PostgreSQL Password
Enter the password for the database super user (postgres) which you defined when installing PostgreSQL.
This enables access to the PostgreSQL database.
SYSPRO Embedded Analytics Hosting Port
Indicate the port on which the endpoint will be hosted.
Default port number provided: 8090
Accept the default provided or change manually to match your preference.
If the SYSPRO Application Gateway and are installed on different machines, ensure that you add port 8090 to your firewall to ensure successful communication between them.
SYSPRO Application Gateway Endpoint
This indicates the hosting endpoint for the SYSPRO Application Gateway service.
For example:
http://localhost:30800
SYSPRO Application Gateway Authentication Key
Enter the authentication key for the SYSPRO Application Gateway, as defined during the install of the SYSPRO Application Gateway service.
For example:
AppGatewayKey321
-
From the SYSPRO License Agreement screen, read and accept the license terms and conditions before continuing with the install.
-
A summary of all products to be installed is displayed for you to review.
Once you are satisfied with the list, continue by selecting the Begin Install button.
-
The Install Complete screen is displayed with a summary of all products installed.
When installing any service that requires a port number entry, ensure that you configure your firewall appropriately to allow access through your selected port(s).
-
Launch SYSPRO 8 2022 (or a later version).
-
Open the Setup Options program (SYSPRO Ribbon bar > Setup).
-
Navigate to the Connectivity System Setup form (Setup Options > System Setup > Connectivity).
-
Enable the Use Application Gateway service option.
-
Enter the service endpoint for the Application Gateway service endpoint.
For example:
http://Localhost:30800
-
At the Authentication key field, enter the SYSPRO Gateway Authentication key which you used when installing the SYSPRO Application Gateway service.
For example:
AppGateWayPass123
-
Select the Test connection function to confirm all details captured are correct and that you can connect to the service successfully.
-
Save your changes and exit the program.
-
Exit SYSPRO.
-
Launch SYSPRO 8 2022 (or a later version).
-
Open the Setup Options program (SYSPRO Ribbon bar > Setup).
-
Navigate to the Connectivity System Setup form (Setup Options > System Setup > Connectivity).
-
Within the section, ensure that the Embedded Analytics enabled option is enabled.
-
At the Analytics Endpoint field, you should see that entry has already been configured based on your install.
For example: http://Localhost:30800/composer
-
Select the Test connection function to confirm that you can connect to successfully.
-
Select the Configure function to setup the environment for use within SYSPRO.
The system then performs various functions in the background, including:
-
Configure the SYSPRO Embedded Analytics user interface.
-
Change default passwords against the default admin and supervisor users that are shipped with the product.
-
Import and apply OEM licensing and SYSPRO branding.
-
Setup SYSPRO Embedded Analytics instance and accounts
-
Create trusted access client for authentication.
-
Configure initial Data Source.
-
Add security groups for dashboards consumers and creators.
Users that only view data are added to the dashboard consumer group and users that create dashboards are added to the dashboard creator group.
-
Create SQL login with read access to all of your SYSPRO companies and system wide dataset.
-
Create default connections in the environment.
These are used for the sample dashboard packs shipped with the product and can be used by you to create dashboards that will show data for any SYSPRO company.
-
-
Save your changes and exit the program.
-
Restart SYSPRO for your changes to take affect.
Operator Permissions
To design dashboards, a SYSPRO operator must be configured with the correct access:
-
Launch SYSPRO 8 2022 (or a later version).
-
Open the Operator Maintenance program (SYSPRO Ribbon bar > Setup > Operators).
-
Select the operator for whom you want to assign designer access for .
-
Navigate to the Options pane (in the SYSPRO Desktop UI) or the Functions pane (in the SYSPRO Web UI (Avanti)).
-
Enable the option.
-
Save your changes and exit the program.
The system then calls into the environment and creates a user linked to this operator with permissions to create dashboards.
-
Restart SYSPRO for your changes to take affect.
Designer Program Access
For Embedded Analytics Designers to be able to access the Embedded Analytics Designer program, access must be granted to either their group or role:
-
To define Embedded Analytics Designer access by role:
Apply access control against the operator's group within the Operator Groups program (SYSPRO Ribbon bar > Setup).
-
To define Embedded Analytics Designer access by group:
Apply access control against the operator's role within the Role Management program (SYSPRO Ribbon bar > Setup).
The following considerations are being addressed and should be resolved with a later release of the software:
-
A warning message is displayed when you add a new connection that uses Microsoft SQL Server 2022, however this does not prevent you from proceeding.
-
KPI or Metric visualizations don't have a drill-down capability.
-
When using the Embedded Analytics Designer program in the SYSPRO Web UI (Avanti) version:
-
After creating a new dashboard, you must log out and back in for the new dashboard to reflect within the list of Embedded Analytics cards.
-
When you change your settings to use the Dark theme, you must refresh the page for the change to reflect.
-
-
The SYSPRO Embedded Analytics module doesn’t currently support the following within your SQL server name configuration:
-
TCP protocol or Named Instances
View the Why doesn't the Embedded Analytics Designer program render when launched? FAQ within the Solving section of this topic for solution details.
-
User defined SQL port numbers (i.e. SQL port numbers outside of the defaults provided)
Please contact your local support office for assistance with any issues around connection strings until a hotfix is made available to resolve this.
-
Solving
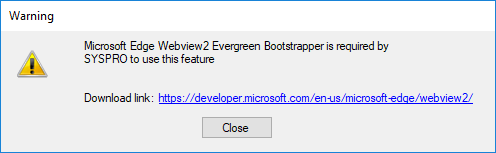
The SYSPRO Desktop client web browser capabilities have been enhanced to utilize the latest Microsoft Edge WebView2 control technologies, allowing for rich and secure web browser experiences within SYSPRO.
This provides a more responsive browser experience and improves the compatibility between third-party web-based solutions and SYSPRO.
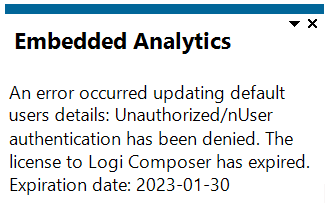
This message is displayed if the Microsoft Edge WebView2 control is not installed on your machine when you access the Embedded Analytics Designer program (i.e. one of the features that use Microsoft Edge exclusively from SYSPRO 8 2022).
Ensure to install the Microsoft Edge WebView2 controller on all client machines that require access to the Embedded Analytics Designer program.
You can download the runtime from the following link:
https://developer.microsoft.com/en-us/microsoft-edge/webview2/
When downloading the runtime, select either the Evergreen Bootstrapper download button, or the X64 button beneath the Evergreen Standalone Installer option.
Do not install the Fixed Version.
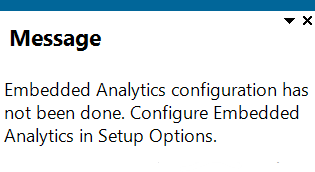
This message is displayed when you attempt either of the following without first running the configuration:
-
When you attempt to define a SYSPRO operator as an in the Operator Maintenance program.
-
When you attempt to open the Embedded Analytics Designer program.
Once you have installed the SYSPRO Embedded Analytics module, ensure to complete the setup and configuration within the Setup Options program (Setup Options > System Setup > Connectivity).
Your environment is then configured when you select the Configure function within the section.
This message may be displayed when you attempt to restore the connection to dashboards by restarting services, reinstalling or selecting one of the following hyperlinks within the Setup Options program (Setup Options > System Setup > Connectivity):
-
The Configure hyperlink at the section.
-
The Test Connection hyperlink at the Application Gateway service settings or the section.
Follow these steps to resolve this issue:
-
Stop all Zoomdata services, in the following order:
-
Zoomdata
-
Zoomdata EDC Sparksql Connector
-
Zoomdata EDC S3 Connector
-
Zoomdata EDC Redshift Connector
-
Zoomdata EDC Trino Connector
-
Zoomdata EDC Mongo Connector
-
Zoomdata EDC Hive Connector
-
Zoomdata EDC Couchbase Connector
-
Zoomdata EDC Cloudera Search Connector
-
Zoomdata EDC Bigquery Connector
-
Zoomdata EDC Postgresql connector
-
Zoomdata Screenshot Service
-
Zoomdata Query Engine
-
Zoomdata Data Writer Postgresql
-
Zoomdata EDC Mssql connector
-
Zoomdata Consul
Skip this step if you're not using a specific service.
-
-
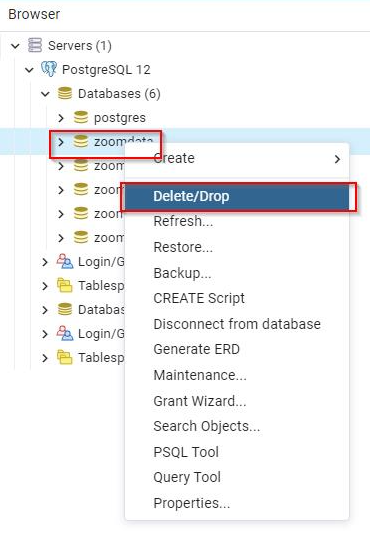
Delete the ZoomData database from PostgreSQL (Postgress Admin).
-
Run a repair on SYSPRO Embedded Analytics.
-
Select Programs and Features from the Windows Control panel.
-
Locate and select SYSPRO Embedded Analytics and then select Change.
The SYSPRO Embedded Analytics Setup wizard is displayed.
-
Proceed through the setup wizard, selecting the Repair option.
When prompted to reboot, select OK.
Once done, select Finish to close the setup wizard.
-
-
Run the following scripts on the SYSPRODB (system wide database):
CopyDELETE AdmSystemControl WHERE RecordType = 'SYSSEA' DELETE AdmOperatorPwd WHERE PasswordType IN ('SEACLI','SEAADM','SEASUP','SEASQL','SEAOPR') -
Reconfigure the Analytics Endpoint and test the connection (Setup Options > System Setup > Connectivity).
Once you have installed PostgreSQL 12 and the SYSPRO Application Gateway service, the following indicates the processes which occur when you select to install using the SYSPRO Installer Application:
-
The app collects all the required information for the install, ports, passwords, etc.
-
The connection to PostgreSQL is validated.
-
The required files are deployed.
-
The applicable services are created.
-
Property entries are updated.
-
The app calls the SYSPRO Application Gateway and creates the applicable entry within the C:\ProgramData\SYSPRO\Application.Gateway\appsettings.reverseProxy.json file.
-
The database and database user are created:
The SYSPRO Embedded Analytics.msi retrieves the properties passed to it to enable access to PostgreSQL and create the required databases, as well as a user called zoomdata.
-
The services are started in the following order:
-
PostgreSQL (unless already running)
-
SYSPRO Application Gateway (unless already running)
-
Zoomdata Services:
-
Zoomdata_consul
-
Zoomdata_edc_* (i.e. data sources or connectors)
-
Zoomdata_query_engine
-
Zoomdata_data_writer_postgresql
-
Zoomdata_screenshot_service
-
Zoomdata_service
-
-
-
Registry entries are written.
-
The SYSPRO Deployment Database is updated.
The SYSPRO Install stores its registry keys under the following path:
HKEY_LOCAL_MACHINE\SOFTWARE\SYSPRO\Installs\SYSPRO Embedded Analytics
Do not edit the zoomdata.properties file manually (i.e. outside the install) as any changes you make will be lost when you perform a repair of the install.
The following ports are used:
|
Port number |
Service name |
Comments |
|---|---|---|
|
5432 |
Zoomdata-postgres |
Composer metadata repository |
|
5580 |
Zoomdata-query-engine |
Composer query engine microservice |
|
8090 |
Zoomdata |
Composer server |
|
8081 |
Zoomdata-data-writer |
Composer Data Writer microservice |
|
8083 |
Zoomdata-screenshot-service |
Composer Screenshot microservice |
|
8100 |
Zoomdata-edc-mssql |
Microsoft SQL Server connector |
|
8105 |
Zoomdata-edc-postgresql |
PostgreSQL connector, Flat File uploads, and Upload API processing |
|
8300 |
Zoomdata-consul |
Internal port used by the Consul for inter-node communication in a distributed environment |
|
8301 |
Zoomdata-consul |
Internal port used by the Consul for inter-node communication in a distributed environment |
|
8302 |
Zoomdata-consul |
Internal port used by the Consul for inter-node communication in a distributed environment |
|
8443 |
Zoomdata |
Composer HTTPS requests |
|
8500 |
Zoomdata-consul |
Consul |
As the SYSPRO Embedded Analytics module doesn't form part of the standard SYSPRO release cycle, the update process for this module is slightly different to other SYSPRO products.
Therefore, when an update is made available, proceed as follows:
-
Launch the SYSPRO Installer Application.
-
Once a connection is made to the SYSPRO Deployment Service, login using your InfoZone credentials.
If you are a partner or super-user, enter the applicable Customer ID for the customer being installed.
-
From the SYSPRO Installer home screen, select the SYSPRO Additional Software option.
-
From the Additional Software Packages screen, select the SYSPRO Embedded Analytics option.
-
If an update is available when the SYSPRO Embedded Analytics page loads, the existing local product files (including the related install files) are deleted and the latest files are retrieved from Azure. This ensures that the latest files are always used.
The SYSPRO Embedded Analytics version then has an Upgrade button. Select the button to proceed with the update.
-
From the SYSPRO License Agreement screen, read and accept the license terms and conditions before continuing with the update.
-
A summary of all products to be updated is displayed for you to review.
Once you are satisfied with the list, continue by selecting the Begin Upgrade button.
-
The Upgrade Complete screen is displayed with a summary of all products installed.
You can uninstall the service via the Windows Programs and Features application.
Take note though that you can't remove the existing configuration of your environment as configuration data is stored both in the SYSPRO SQL and PostGres databases which can't be deleted once configured.
However, you can use the Embedded Analytics enabled setup option (Setup Options > System Setup > Connectivity) to activate or deactivate the usage of the feature, if required.
If you need to restart the zoomdata services for any reason, ensure to start them in the following order:
-
Zoomdata_consul
-
Zoomdata_edc_* (i.e. data sources or connectors)
-
Zoomdata_query_engine
-
Zoomdata_data_writer_postgresql
-
Zoomdata_screenshot_service
-
Zoomdata_service
The following article provides guidelines on how to backup and restore your PostgreSQL data:
Stopping the zoomdata_consul service should stop all other services as they are dependent on the zoomdata_consul service.
After a new install or upgrade, you might not be able to access until the zoomdata service has completed its checks and database updates (which can take up to 15 minutes).
To verify if this is the cause for your services not starting, open the Task Manager and look for a high running java process that belongs to zoomdata. If present, wait for the process to calm down, after which you should be able to continue.
If however, this does not resolve the problem, check to see if the port is already in use by another application.
See the What ports does use FAQ for information regarding port numbers.
If the above doesn't resolve the issue either, proceed as follows:
-
Check the log files for any error recorded.
-
Stop all of the zoomdata services.
-
Delete the log files.
-
Restart the zoomdata services in correct sequence:
-
Zoomdata_consul
-
Zoomdata_edc_* (i.e. data sources or connectors)
-
Zoomdata_query_engine
-
Zoomdata_data_writer_postgresql
-
Zoomdata_screenshot_service
-
Zoomdata_service
-
There are a few possible reasons for your not being able to connect to . Therefore, check each of the following:
-
SYSPRO Application Gateway service:
-
Check the configuration file of the SYSPRO Application Gateway for an Embedded Analytics entry.
-
-
PostgreSQL:
-
Check if anything has been changed in your PostgreSQL configuration.
-
Confirm that you have the correct version of PostgreSQL: PostgreSQL 12.
-
-
SYSPRO Configuration:
-
Validate your connection to the endpoint by using the Test Connection function against the setup option (Setup Options > System Setup > Connectivity).
-
If your permissions are not automatically set after importing a template dashboard, proceed as follows:
-
Open the Setup Options program (SYSPRO Ribbon bar > Setup).
-
Navigate to the Connectivity System Setup form (Setup Options > System Setup > Connectivity).
-
Select the Configure function.
This not only sets up the environment, but also re-imports the custom JavaScript file that controls the permission setting events.
-
Exit the Setup Options program.
-
-
Open the Embedded Analytics Designer program (Program List > Embedded Analytics).
-
Navigate to the Library and select the imported dashboard.
-
Make any small change (so that the Save function becomes available) and save your change.
-
Exit the program.
-
All future imports and saves will then set the permissions correctly once the system has been updated.
If the Embedded Analytics Designer program doesn’t render correctly, it may be due to the configuration of your SQL Server name.
If your SQL Server name is preceded by TCP:, then this results in the program not seeing an active connection to Microsoft SQL Server.
To resolve this, proceed as follows:
-
Open the Setup Options program and navigate to the SQL System Setup form (Setup Options > System Setup > SQL).
-
From the SQL Server name field (within the Company database connection section) remove TCP: from the name.
For example:
Original SQL Server name = TCP:JONDOE
Changed SQL Server name = JONDOE
-
Save your changes and restart SYSPRO for your changes to take affect.
The designer operator can then access the Embedded Analytics Designer program once they log back into SYSPRO.
The is responsible for the dashboard management process, including:
-
Viewing dashboard information (i.e. dashboard name, the data source behind it, the content author and the last modified date)
-
Managing existing dashboards
-
Placing existing visuals (that were created in the gallery) into a dashboard
-
Creating new visuals within the dashboard canvas
-
Managing dashboard permissions (i.e. providing dashboard access to users and groups)
-
Marking specific dashboards as a favorite
Visuals and dashboards allow you to analyze your data in a variety of ways.
-
A visual is a single view of data source data.
These can be stored and added to dashboards using the Visual Gallery.
-
A dashboard is a collection of one or more visuals.
The visuals in a dashboard can be based on one data source or multiple data sources.
A derived field is an in-memory column for your data table that is populated with results from calculations performed on data already in your table:
-
You can create derived fields using row-level expressions that are built using row-level functions.
-
These calculations are performed at the level of a row, that is, a record, and do not include other data from your table that is outside of that particular row.
-
If a source supports derived fields, then you can use them as arguments for aggregate functions when creating other calculations.
-
Derived fields can be created from other derived fields.
-
Data types are automatically assigned to your derived fields.
Keysets are a more advanced filtering mechanism, as they represent collections of unique data values that can be saved and used in further data analysis across data sources.
Considerations:
-
Keysets let you perform multi-pass and multi-source filtering of the data.
-
You can create a keyset by selecting a single field for the keyset from visual data.
Filtering the visual data before creating the keyset limits the unique data values the keyset includes.
-
The field you select for the keyset is known as the keyset's key field.
For example:
From a visual that lists airport codes nationwide but that has been filtered to show only Virginia airports, you can create a keyset listing only Virginia airport codes by selecting the airport code field as the keyset's key field.
-
You can create and update a keyset in various ways:
-
From the Visual Result Set
-
From a Data Point
-
From a CSV File
-
-
You can apply a keyset as a visual filter to limit the visual's result set to records containing values stored in the keyset.
-
Keysets can be applied as filters to other visuals that use the same or different data sources. However, the data source for the target visual must contain a field storing the same kind of data as the keyset's key field.
-
When working with multiple filter types on the same visual, row-level filters (including wildcard filters) are applied first to a visual, keyset filters are applied second, and group filters are applied last on the aggregated result set.
You can apply row-level, group or saved filters (to narrow the scope of the data in a visual) from the Visual Gallery panel, or from within the Dashboard Designer.
When working with multiple filter types, row-level filters are applied first to a visual, keyset filters are applied next, and group filters are applied last on the aggregated result set.
The remainder of this FAQ focuses on adding filters from the Visual Gallery.
Applying a row-level filter
-
From the Embedded Analytics Designer program, navigate to the Visual Gallery panel and select the visual against which you want to define a filter.
-
Select the
 (i.e. Filters) icon from the Sidebar Customization Options.
 -
Select the Add Filter function.
-
From the Row tab, select the filter attribute, number, or time field that you want to use from the list.
You can also select the
 icon against either of these sections to access the Derived Field Editor or the Custom Metrics Editor to create or modify derived fields and custom metrics to be used as filters.
The process of creating a row-level filter varies based on the type of field you select:
-
Using an attribute field as your filter:
This lets you filter visual data by the values in an attribute.
-
Select the filter attribute that you want to use from the list of available attributes.
A second page with three tabs appears in the Filters sidebar.
-
From the Value tab:
-
Indicate a filter operator (Include or Exclude, depending on whether you want to include or exclude the value from the data).
-
Indicate an optional custom value.
To create and select a custom value, enter the value in the Customize field and select Add. Your custom field is added and selected in the list of possible values.
To remove the custom value, uncheck it in the list of possible values. It is removed from the filter and from the list of possible values for the filter.
-
Select one or more values from the list of available values for the attribute you selected, or use the Select All function to select all values.
Quickly find a value by typing the name of the value in the Search bar to limit the list of values.
A maximum of 1000 values are listed.
-
-
From the Wildcard tab, specify a wildcard filter for the attribute.
-
From the Keyset tab, select a keyset filter for the attribute.
-
-
Using a numeric field as your filter:
This lets you filter visual data by the values in a numeric field.
-
Select a numeric field that you want to use from the list of available number fields.
A second page with two tabs appears in the Filters sidebar.
-
The Range tab initially shows the full range of values available. It provides an Operator selection box and From and To boxes for you to use to select the range of values.
-
Select a relational comparison operator in the Operator selection box.
Data is included in the visual when the data in the filter field meets the condition set by the relational operator and the numeric values you specify.
-
Use the arrows in the From and To boxes to increase and decrease the maximum and minimum values.
-
-
From the Keyset tab, select a keyset to apply as the filter.
-
-
Using a time field as your filter:
This lets you filter the time range displayed on the visual.
-
Select a time field you want to use from the list of available time fields.
A second page with two tabs appears in the Filters sidebar.
-
From the Range tab, use the From and To boxes to specify the time range for the filter.
You can set the range in static time or dynamic time, or use variables. Alternatively, you can use the preset ranges provided.
-
If you select Static Time, the From and To boxes are filled with default dates and times. Use the boxes to select specific from and to times.
-
If you select Dynamic Time, the From and To boxes are filled with Start of Data Set and End of Data Set automatically. Use the Condition boxes to select different dynamic from and to times.
-
-
Alternatively, select a keyset from the Keyset tab to use for the filter.
-
-
-
After the filter specifics have been provided, select the Continue function.
If you created the filter at the dashboard level, its applied to all the visuals in the dashboard. Otherwise, it is applied only to the selected (i.e. active) visual.
A number appears in a green circle next to the filter icon on the visuals to which the filter has been applied. The number represents the number of filters applied to the visual.
-
Select the Save function to save your changes to the visual.
Applying a Group level filter
You can use group filters to filter the aggregated result set of a visual. Group filters are filters based on metrics and custom metrics, rather than fields (row-level filters).
Considerations:
-
The Group tab is not available if you are using the dashboard filters sidebar.
-
Group filters are applied in the same way row-level filters are applied.
-
Using group filters, you can filter on saved custom metrics that are not applied to your visual.
-
Metrics and custom metrics can also be limited at the data source level.
-
If the Filters sidebar does not display all fields, refresh the field at the data source to display all elements within the data.
-
The following visual styles don't support group filters:
-
Arc gauges
-
KPI charts
-
Histograms
-
Marker maps
-
Tables of raw data
-
-
Global dashboard filters don't include group filters that may be applied to the visuals in the dashboard, even if all the visuals on the dashboard use the same data source.
-
You cannot apply a group filter to your dashboard; only row-level filters (and keyset filters) can be applied globally to a dashboard.
To filter your data by custom metric, proceed as follows:
-
From the Embedded Analytics Designer program, navigate to the Visual Gallery panel and select the visual against which you want to define a filter.
-
Select the
(i.e. Filters) icon from the Sidebar Customization Options. -
Select the Add Filter function.
-
From the Group tab, select the Number and Count Of as required for your filter.
-
After the filter specifics have been provided, select the Continue function.
-
Select the Save function to save your changes to the visual.
You can design your dashboard to refresh either manually with user interaction, or by itself whenever the data changes. For automatic refreshing, the Live Mode and Playback options must be enabled within the source configuration's Time Bar settings.
The Live Mode option is based on a Time field, and the refresh rate is based on the granularity applied to that field within the data source configuration.
For example:
Defining the granularity as Minute allows you to automatically refresh the visuals on the dashboard every minute.
To design your dashboard to refresh automatically, proceed as follows:
-
From the Sources panel of the Embedded Analytics Designer program, locate and select the applicable source configuration.
-
Navigate to the Fields tab and locate the applicable Time field on which you want to base the time-lapse refresh.
-
Ensure the following settings are defined against the field, as per your requirements:
-
Granularity
This lets you define the granularity of the data's refresh rate.
-
Partition (unless your time field includes an Index)
This lets you define a partition for the field by entering the Partition Field and Partition Function.
Certain connectors support partitions which allow you to link a partitioned field to another field to help improve the performance of filtering operations for a data source.
-
-
Navigate to the Global Settings tab.
-
Ensure the following settings are enabled (or defined) against the source configuration:
-
Time Bar
This lets you enable or disable the time bar on new visualizations by default.
The options associated with this setting determine the default time field to be used for new visuals, which allows users to view trend reports from any visual.
-
Enable to allow setting of time bar related global settings here, and to enable the time bar on visuals by default. Users can then disable the time bar for individual visuals as needed.
-
Disable to prevent setting of time bar related global settings and to disable the time bar on visuals by default. Users can then enable the time bar for individual visuals as needed.
-
-
Default Time Attribute
This lets you indicate an available time field to use, by default. The options vary based on the time field in your data source.
-
Playback
This lets you play back your data (like a data DVR).
-
Live Mode
This lets you automatically refresh the data from your data source, based on the refresh rate and delay.
-
Once the above configuration is defined, your dashboard will reflect the visual time bar as Live (by default this is shown in the bottom right corner) along with its refresh rate.
If your dashboard links all its visuals to the same time bar, then all visuals are refreshed asynchronously.
Yes, you can apply multiple filter controls to visuals within a dashboard, by following these steps:
-
Add the filter controls to the dashboard (that already contains the visuals).
-
Select the Dashboard interactions icon.
The Dashboard Interactions window is displayed.
A cross source link is listed in the Links section of the Dashboard Interactions window for every filter control on the dashboard.
-
Select the cross source link where you want to select a specific field for filtering.
-
The different data sources are listed at the Sources section, one of which will be data source of the filtering control.
-
At the Field name, select the field against each data source that you want to use for filtering.
The selected field name should be the same across all data sources.
-
Close the Dashboard Interactions window.
If your dashboard contains visuals that are made up of two or more data sources, then the filter (e.g. the time line) will only apply to the visual that is currently selected.
Applying a filter across all visuals involves a two-pronged configuration process, in which you first link the data sources (this is referred to as cross visual linking) and then apply the filter to the visualisations in the dashboard.
Cross visual linking refers to linking visuals in a dashboard that may have multiple data sources. This is typically done so that a filter can be applied to all visuals within a dashboard.
Applying a filter across all visuals involves a two-pronged configuration process, in which you first link the data sources (this is referred to as cross visual linking) and then apply the filter to the visualisations in the dashboard.
Follow these steps to link visuals within one dashboard by connecting the different data sources:
-
Open the dashboard within the Embedded Analytics Designer program.
-
Select a visual in the dashboard.
-
Select the Dashboard interactions icon.
The Dashboard Interactions window is displayed.
-
Select the Cross-Source Links option.
-
Select the Add Link button to link the data sources.
The current dashboard is displayed at the Links section on the left.
-
In the Link Details section on the right you have to create a link by doing the following:
-
Add a name for the link at the Link Name field and select it.
-
Select the data source you want to link to at the Source Name field.
-
Select the data source field you want to link to at the Field Name field.
All the available fields within that data source will be displayed.
-
Select Add Source to select the second data source.
A new row is displayed.
-
Select the second data source at the Source Name field.
-
You will notice that only fields with the same data type are listed within the Field Name drop-down, i.e. if you have selected a date field at the previous data source, then only date fields within this data source are displayed.
-
Select Apply to save the cross source linking.
You have now configured the link between the data sources.
-
-
Close the Dashboard Interactions window.
-
Select the first button on the Time bar. The description on this button changes depending on the field that is used for the filtering.
The Datasources pop-up window is displayed.
-
In the Applies to section, select multiple cross visual links to ensure that the visualizations all apply the same filter.
-
Save your changes.
Linking to another dashboard is useful when you want to select a data point in one dashboard to drill down and view more information of the selected data in another dashboard. Depending on the data, this may involve filtering the data on the target dashboard.
Follow these steps to link a source dashboard to a target dashboard:
-
Open the dashboard within the Embedded Analytics Designer program.
-
Select the data point in the visual.
-
Select the Dashboard links gears icon.
The Dashboard Links window is displayed.
-
Select the Add Link button.
The Select Link window is displayed.
-
In the Visuals section on the left, select the source visual that you want to link up and in the Dashboard section on the right, select the target dashboard you want to link to.
-
Select Apply to save the link and close the Dashboard Links window.
Your dashboard within the Embedded Analytics Designer program is displayed.
-
Select the Save icon to save your dashboard changes.
-
You can then select the data point in the source dashboard to display a wheel of options.
-
Select the Link option to view the visuals in the target dashboard.
The standard template dashboard packs (supplied by SYSPRO) are shipped with the product and stored within the \Base\Samples folder.
Custom template packs (created by third-party developers) can be stored within the \Work\Analytics folder on the SYSPRO Application server (i.e. you can't export a pack to a client-side folder).
Custom packs are not copied to the \Base\Samples folder.
Each dashboard pack contains the following:
-
Dashboard configuration file
-
All Business Activity Queries used by the dashboard's visuals
-
Metadata file containing details about the pack
-
PDF document with detailed information pertaining to the dashboard within the pack
Certain dashboards contain specific caveats in their use, which is explained, alongside the key metric definitions for each visualization on the dashboards.
To create an dashboard pack and export it (along with all its related files), proceed as follows:
-
Open the Embedded Analytics Export program (Program List > Embedded Analytics).
-
From the Dashboard listview, select the applicable dashboard that you want to export.
-
Once selected, navigate to the Action column and select the Details function against the dashboard.
This opens the Embedded Analytics Pack Details program, from where you can view the meta data associated with the selected dashboard.
In addition, the BAQ details pane indicates all Business Activity Queries that are used by or associated with the selected dashboard pack.
-
Within the Pack details form, update the entries as required:
-
Name and Description:
Leave as is, or edit as required.
The more descriptive you are in your naming convention and description, the easier it is for other users to identify and understand the purpose of the dashboard pack.
-
Owner:
Indicate the user responsible for the dashboard pack creation.
-
Documentation:
Upload a PDF document to provide all the related details for the dashboard pack.
This allows the creator of the dashboard pack to provide:
-
Documentation about the pack and what it hopes to achieve
-
What visuals are included within the dashboard
-
What users should expect to see in within the dashboard.
Use the Preview function to view the document using the Document Viewer program.
-
-
URL:
Optionally indicate a website for more information about the dashboard author or their company.
-
-
Select the Save function to record your changes.
You are returned to the Embedded Analytics Export program.
-
Select the Export Selected Dashboards toolbar function.
This exports each pack in its entirety to a zip file (which includes all of its related files) with a seax extension.
This zip file is exported to the \Work\Analytics folder on the application server.
Considerations:
-
If the pack name already exists, a subscript is added to the end of the file name (e.g. Financial_Manager(1).seax).
-
The following characters are replaced in the file name:
-
All spaces are replaced by an underscore (_)
-
All semicolons are replaced by a dash (-)
-
-
-
Exit the program.
To import an dashboard pack (along with all its related files), proceed as follows:
-
Open the Embedded Analytics Import program (Program List > Embedded Analytics).
You are presented with a list of all dashboard packs found within the following folders on the application server:
-
\Base\Samples
-
\Work\Analytics
-
-
From the listview, select the applicable dashboard that you want to import.
-
Once selected, navigate to the Details column and select the Details function against the dashboard.
This opens the Embedded Analytics Pack Details program, from where you can view the meta data associated with the selected dashboard.
In addition, the BAQ details pane indicates all Business Activity Queries that are used by or associated with the selected dashboard pack.
-
Within the Pack details form, you can optionally preview the PDF document saved against the Documentation field.
This allows the creator of the dashboard pack to provide:
-
Documentation about the pack and what it hopes to achieve
-
What visuals are included within the dashboard
-
What users should expect to see in within the dashboard.
-
-
Exit the Embedded Analytics Pack Details program to return to the Embedded Analytics Import screen.
-
Select the Import toolbar function.
The import process creates the required connections, sources and visuals it needs to populate the dashboard.
-
Exit the program.
Imported dashboards are displayed in the Library of the Embedded Analytics Designer program, with the operator that imported the pack listed as the Author for that dashboard. From there you can modify and tailor the dashboard according to your requirements.
Contextual analytics are possible when you link an dashboard to key program fields or key form fields (within either the SYSPRO Desktop or SYSPRO Web UI (Avanti) application).
As data forms within SYSPRO are refreshed with new information, the associated key field(s) are promptly passed to the embedded dashboard. Consequently, the dashboard undergoes a refresh, precisely tailoring the analysis to adhere to the applied filter(s).
The convenience of these dynamic filters adapting to your context within SYSPRO eliminate the need for manual filtering.
Considerations:
-
A dashboard embedded within a SYSPRO program can have a maximum of five (5) mapped fields (i.e. dimensions) impact and influence the dashboard on the fly.
-
Users cannot undo or reverse the filters associated with a dashboard defined with filter mappings. Whereas, users can set filters at runtime when no filter mappings are defined for the dashboard.
-
Contextual analytics can also be defined within programs created using the Application Designer.
Before being able to utilize the contextual analytics capability, you must first design your dashboard with multiple dimensions, as required.
The following then explains the process administrators can follow to place this dashboard into a SYSPRO program with contextual capabilities:
Your operator must have ADMIN rights to be able to design web views.
-
Log into SYSPRO 8 2023 or later.
-
Navigate to the program in which you want to embed the dashboard.
For example:
Inventory Query (i.e. INVPEN)
-
From the program's toolbar, launch the Visual Designer by selecting Design Web View from the
 Customize icon.
This allows you to design the program's existing template web view and embed the dashboard.
For example:
Within the Inventory Query program, select the Primary Layout from the Design Web View option. Then select to use the existing template for the program.
-
Once the Visual Designer program is launched, proceed as follows:
-
Select the Add layout section option.
-
From the Configure new layout section screen, select the Embedded Analytics card.
-
From the Select Dashboard section, select Other and then indicate the applicable dashboard you want to embed.
-
Within the Filter mappings section, select the key fields to which you want to link within the dashboard (i.e. create the link). These mapped fields are then used to filter the dashboard data at runtime.
Once you've selected the Key Field, select the matching Dashboard Field.
For example:
Key field = StockCode
Dashboard field = stockcode
Using the Add new row function, you can define up to 5 mapped fields.
The Delete function lets you remove a field mapping.
-
Select the Add Section function.
-
Move the newly added dashboard card to your preferred location and size it according to your requirements.
-
Save the layout and close the application.
-
-
Exit the program.
This newly designed layout, including the contextualized dashboard, will be available within that program when you next log in. The mapped filters are then dynamically set to equal the SYSPRO Key field values during runtime when the page is refreshed.
The SYSPRO Application Gateway ensures that any request within SYSPRO to display dashboards is communicated through this service.
In addition, this service enables the SYSPRO Web UI (Avanti) to be run in HTTPS when accessing dashboards. The reason for this is that, as you can't mix HTTP and HTTPS content in a web client, any analytical data requested needs to be provided over an HTTPS connection for security purposes.
Yes, you can connect to any Microsoft SQL or PostgreSQL database, thereby enabling data analysis and blending with other data.
For example:
You can blend data from the Manufacturing Operations Management solution with inventory data, alongside time and attendance data or clocking information from a third party HR solution.
further compliments the capabilities that the following features provide by allowing you to analyze their data:
-
Dimension Analysis
-
Group Payments
-
Kanban Automated Replenishment
-
Sales Pricing Engine
Using
The Embedded Analytics Designer program is where you can configure your data connections and sources for , as well as design and view browser-based business intelligence dashboards:
The Connections panel lets you manage all active connections to the available smart connectors. Its where you connect to your data store by inputting your database credentials and connection string.
-
You can setup many connections to different databases, which will then apply within the Sources panel.
-
Available connections are defined by the embedded analytics designer.
The following data connectors are included with your installation of :
-
Microsoft SQL Server
-
PostgreSQL
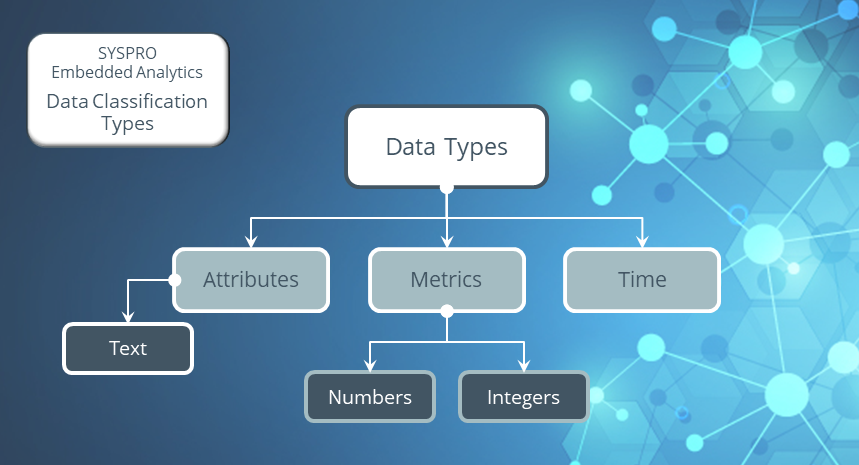
uses a classification system to interpret and bucket your data into three primary types:
-
Attributes
-
Metrics
-
Time
Primary Data Type: Attributes
Attributes represent a set of discrete labels (i.e. categories) that are often grouped together in charts.
Considerations:
-
Data that is categorical in nature.
-
Used in visuals as the “group by” object.
For example:
Airport, Airlines, User ID, State, City, product name
Related Data Type: Text
This is a related data type for attributes which has a relationship that’s defined based on being an object that can be categorized. Text is primarily used in conjunction with smart connectors that have a text search capability.
Considerations:
-
Data that is categorical in nature, just like attributes.
-
Primarily used with search-based connectors.
For example:
Apache Solr, Cloudera search and Elasticsearch use cases
Primary Data Type: Metrics
This is a numerical unit used for calculations and aggregations. Common metrics may be the order count, revenue generated, etc.
These are broken down into two sub classifications:
-
Numbers (i.e. floating values)
-
Integers (i.e. whole numbers)
Considerations:
-
Used in calculations and aggregation
-
Often used as a baseline count
Primary Data Type: Time
This is a special typing in as time is treated as the primary driver for smart data insights and provides the ability to view historical datasets over configured points in time.
Considerations:
-
You can explore historical data with the Timebar.
-
Some data sources allow for data playback and live streaming.
The Source panel enables you to manage all active source definitions currently available within the selected account, as well as leverage a connected data store to build a new source configuration.
Once you connect to a database, you can generate a source configuration (i.e. pull data and prepare it to be used in conjunction with a visual or dashboard) by using one of the following:
-
Business Activity Queries
-
Table and database schema
-
Materialized view
-
Custom SQL statement (i.e. for more detailed definition)
The selected data is then prepped for end user consumption by applying friendly names, filter defaults, distinct count, etc.
The source configuration is then saved for future visual creation.
The Visual Gallery panel is where you can build a single, reusable visual that’s driven by one of your defined sources.
The visualization types available include:
-
Arc gauge
-
Bar charts:
-
Bars
-
Histogram
-
Multiple metrics
-
-
Box plot
-
Bullet Guage
-
Combo chart
-
Donut
-
Floating bubbles
-
Heat map
-
KPI
-
List filter
-
Packed bubbles
-
Pie chart
-
Pivot table
-
Table
-
Scatter Plot
-
Tree map
-
Word cloud
The design capabilities within the visualization manager enable you to tweak and customize your visual, which you can then place into a dashboard later on.
The Library panel houses of all your existing dashboards (either created by you or shared with you from another author) and provides access to the Dashboard Designer, from where you can create new dashboards.
The dashboards within your library can be embedded within SYSPRO in various ways:
-
SYSPRO Web UI (Avanti):
-
Role-based SYSPRO Workspaces
-
Program web views
-
-
SYSPRO Desktop:
-
Main Menu
-
Program web views
-
Application Builder
-
Application Designer
-
The is responsible for the dashboard management process, including:
-
Viewing dashboard information (i.e. dashboard name, the data source behind it, the content author and the last modified date)
-
Managing existing dashboards
-
Placing existing visuals (that were created in the gallery) into a dashboard
-
Creating new visuals within the dashboard canvas
-
Managing dashboard permissions (i.e. providing dashboard access to users and groups)
-
Marking specific dashboards as a favorite
Dashboard capabilities include the following:
-
Inline visually connected filters (i.e. any selection in one filter affects the others)
-
Dashboards as a whole can be governed by a time bar or time series (which when changed, affects all linked visuals)
-
Map type visuals can be zoomed into, enabling you to map countries, states and geolocations, etc.
-
Radial menus allows drill down, trending, zooming into data, etc.
-
End users can change the axis and dimensions being used on any of the visuals on-the-fly. The dashboard reverts to its original dimensions when the user exits and reloads the dashboard or workspace.
-
Zooming into data opens a listview (or data table) which represents the data behind the dashboard visual.
This data can then also be exported to an Excel worksheet if required.
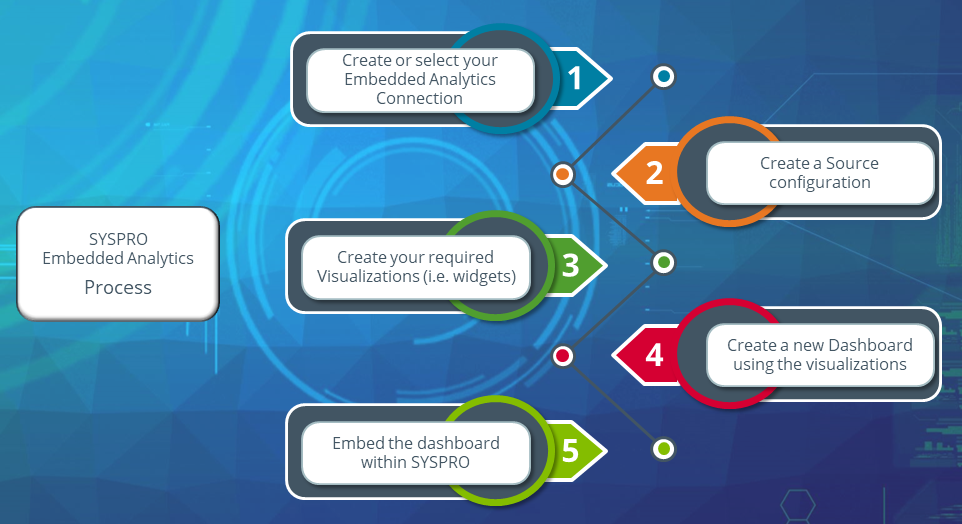
The following explains how to achieve each step of this process in detail:
The first step to creating dashboards, is to ensure you have a valid connection defined:
-
Open the Embedded Analytics Designer program (Program List > Embedded Analytics).
-
Navigate to the Connections panel.
-
Select an existing connection by using one of the standard connections shipped by SYSPRO:
-
SYSPRO Dynamic Connection
-
SYSPRO Templates
Alternatively, you can add a new connection by selecting the ADD Connection function:
-
From the Connection Type window, select your required type of connection.
-
MS SQL
-
PostgreSQL
-
-
From the Input Credentials screen, enter your applicable credentials for the selected connector.
For example:
When selecting the MS SQL connector, enter the following information:
-
Connection Name
-
Jdbc Url
-
User Name
-
Password
-
-
Select the Validate function to save your newly created connection.
Your new connection is then included in the list of available connections.
-
The next step is to generate a source configuration by pulling your data and preparing it for use within a visual or dashboard:
-
Open the Embedded Analytics Designer program (Program List > Embedded Analytics).
-
Navigate to the Sources panel.
-
Select either an existing source configuration, or the Add Source function to create a new source configuration.
Proceed as follows when creating a new source:
Within the Source Definition section:
-
Indicate a unique name for the source configuration.
-
Optionally define a description for the source, so that other users can easily understand its use case.
Within the Data Entity Definition section:
-
Select the Add function to define your data entity (either from one of your connections or from a file).
For the remainder of this task, we are using the SYSPRO Dynamic Connection as an example.
-
Within the Data Entity Details section, enter an applicable Data Entity Name.
-
At the Select Connection field, indicate which connection you want to use for the source.
If you selected to add a source based on a file (and not a connection) use the Upload New File option to select the file you want to use.
-
At the Select Entity field, indicate which tables you want to use from your data connection.
-
From Available Fields, indicate which columns you want to bring through for use within the visualization.
-
Select the Apply function to save your data entity.
-
Select the Save Source function to save your newly created source configuration.
-
-
Navigate back to the Sources panel.
Your newly created source configuration is included in the list of available sources.
Once your connection and source configuration have been defined, you can start creating the required visuals that you want to use within a dashboard:
-
Open the Embedded Analytics Designer program (Program List > Embedded Analytics).
-
Navigate to the Visual Gallery panel.
-
Select the Add Visual function:
-
From the Select a Source screen, indicate the source on which you want to base the visual by selecting it.
-
From the Select Visual Type screen, indicate the visual type that you want to use.
Your new visual is then displayed.
-
-
Select the Info icon (
 ):
):-
At the Visual Name field, enter an applicable title for the visual.
-
Select the Save function.
You will notice that the name of your visual now renders at the top of the screen.
-
-
The remaining customization is not mandatory but enables you to customize the visual even further:
-
Visual Style (
 )
)Change the visual style.
-
Sort & Limit (
 )
)Define how the data is sorted, aggregated, ordered and limited.
-
Filters (
)Add filters to the visual.
-
Time Bar (
 )
)Define a time series for the visual.
-
Settings (
 )
)Indicate the visual's orientation, labels and style.
-
Rulers (
 )
)Customize how the X and Y gridlines appear.
-
Color (
 )
)Change the visual's color palette.
-
Interactivity (
 )
)Define the level of user interaction allowed.
-
-
Once you have completed your customization, select the Save function from the toolbar.
-
From the Save Options window, confirm your acceptance of the visual's title and name.
-
Navigate back to the Visual Gallery panel.
Your newly created visualization is included in the list of available visuals.
You can now create your dashboard using the connection, source and visuals configured in the previous steps:
-
Open the Embedded Analytics Designer program (Program List > Embedded Analytics).
-
Navigate to the Library panel.
-
Select the Add Dashboard function.
You are presented with two options:
-
Add Visual
This lets you create a new visual on-the-fly for use within the dashboard.
-
Place Existing Visual
This lets you pull in an existing visual from your Visual Gallery.
For the remainder of this task, we are using the Place Existing Visual as an example.
-
-
From the Select a Visual window, indicate which visual you want to pull onto the dashboard.
Once selected, the visual is immediately added to the dashboard canvas.
-
Add as many visuals as you require.
-
You can also re-size the visuals and move them around on your dashboard canvas.
-
Use the context menu that appears on each visual (when you select the ellipses from the visual's top right-hand corner) to customize the dashboard visuals further.
-
-
Once you are happy with the contents and layout of your dashboard, select the Save icon.
-
Navigate back to the Library panel.
Your newly created dashboard is included in the list of available dashboards.
Selecting the dashboard again lets you preview or edit it.
Previewing a dashboard is useful for dashboard authors to test what the end user experience will be like once the dashboard is embedded in SYSPRO.
The final step is to embed your newly created dashboard in SYSPRO:
Process to follow when embedding your dashboard within a Workspace in the SYSPRO Web UI (Avanti):
-
Log into SYSPRO 8 2022 (or later) using the web UI.
Ensure that you are not currently logged into a role before proceeding.
-
Select the Customize icon
, followed by the Design Web Views by Role option. -
Select the role against which you want the workspace (and its associated dashboards) to apply.
-
Once in design mode, select the Customize icon
, followed by Design Workspace for Role: xxx.Select the New Workspace option.
-
Indicate an applicable name for the new workspace.
The Visual Designer program is launched:
-
Select the Add layout section option.
-
From the Configure new layout section screen, select the Embedded Analytics card.
-
From the Select Dashboard section, select Other and then indicate the applicable dashboard you want to embed.
-
Select the Add Section function.
You can add as many layout sections as required and embed multiple visualizations or dashboards.
-
Move the newly added dashboard card to your preferred location and size it according to your requirements.
-
Save the layout.
-
-
Exit design mode by selecting the Customize icon
, followed by Stop Designing by Role.
When a user within that role next logs into the Web UI, the newly created workspace will be available for them to access.
Process to follow when embedding your dashboard within a program's web view in the SYSPRO Web UI (Avanti):
-
Log into SYSPRO 8 2022 (or later) using the web UI.
Ensure that you are not currently logged into a role before proceeding.
-
Open the program in which you want to embed your dashboard.
-
Select the Customize icon
, followed by the Design Web View option. -
Select the section in which you want the dashboard to appear.
A Primary layout is used in this example.
-
This launches the Visual Designer, from where you are prompted to confirm if you want to use the program's template (if an existing template applies to the program).
For the purposes of this scenario, select Yes to proceed.
-
Select the Add layout section option.
-
From the Configure new layout section screen, select the Embedded Analytics card.
-
From the Select Dashboard section, select Other and then indicate the applicable dashboard you want to embed.
-
Select the Add Section function.
You can add as many layout sections as required and embed multiple visualizations or dashboards.
-
Move the newly added dashboard card to your preferred location and size it according to your requirements.
-
Save the layout.
-
-
Exit the program.
The dashboard card is then visible for all users when they next log into the SYSPRO Web UI (Avanti) and access that program.
Process to follow when embedding your dashboard within the main menu of the SYSPRO Desktop UI:
This is useful as it allows the dashboard context to adapt to the operator's current role.
-
Log into SYSPRO 8 2022 (or later) using the desktop client.
-
Navigate to and select the Role View option (from the Customize
 menu > Panes section).
The Role View pane is then displayed within your SYSPRO desktop.
-
Enable the Design UI Layouts mode (SYSPRO Ribbon bar > Administration).
-
Indicate the Role against which you want to apply your dashboard (e.g. Account Manager) followed by the Start Design Mode option.
-
The Design Mode In Progress screen is opened. Move this screen out of the way to proceed with the next step.
-
-
Navigate to and select the Design Role View function (SYSPRO Ribbon bar > Home > Role View > Design Role View) so that you can design the role layout for your selected role.
The Application Role View window is displayed.
-
Select the Customize icon
, followed by the Design Web View option.If a web view doesn't yet exist, you are prompted to confirm which type of web view you want to create. Select SYSPRO Client to proceed.
-
This launches the Visual Designer:
-
Select the Add layout section option.
-
From the Configure new layout section screen, select the Embedded Analytics card.
-
From the Select Dashboard section, select Other and then indicate the applicable dashboard you want to embed.
-
Select the Add Section function.
You can add as many layout sections as required and embed multiple visualizations or dashboards.
-
Move the newly added dashboard card to your preferred location and size it according to your requirements.
-
Save the layout.
-
-
You are returned to the Application Role View window, from where you can customize the layout as per your requirements.
-
Close the Application Role View window.
-
-
From the Design Mode In Progress screen, select the Exit Design Mode option.
When a user within that role next logs into the SYSPRO Desktop, the newly created role view will be available for them to select.
This is achieved by selecting the Show Role View option (SYSPRO Ribbon bar > Home > Role View > Show Role View). Operators can then change the shape, size or nature of the dashboard as they require.
-
Log into SYSPRO 8 2022 (or later) using the desktop client.
Ensure that you are not currently logged into a role before proceeding.
-
Navigate to and select the System-wide View option (from the Customize
menu > Panes section).The System-wide View pane is then displayed within your SYSPRO desktop.
-
Enable the Design UI Layouts mode (SYSPRO Ribbon bar > Administration).
-
Select the System-wide option, followed by the Start Design Mode option.
-
The Design Mode In Progress screen is opened. Move this screen out of the way to proceed with the next step.
-
-
Navigate to and select the Design System-wide View (SYSPRO Ribbon bar > Home > System-wide View > Design System-wide View) so that you can design the layout system-wide.
The Application System-wide View window is displayed.
-
Select the Customize icon
, followed by the Design Web View option.If a web view doesn't yet exist, you are prompted to confirm which type of web view you want to create. Select SYSPRO Client to proceed.
-
This launches the Visual Designer:
-
Select the Add layout section option.
-
From the Configure new layout section screen, select the Embedded Analytics card.
-
From the Select Dashboard section, select Other and then indicate the applicable dashboard you want to embed.
-
Select the Add Section function.
You can add as many layout sections as required and embed multiple visualizations or dashboards.
-
Move the newly added dashboard card to your preferred location and size it according to your requirements.
-
Save the layout.
-
-
You are returned to the Application System-wide View window, from where you can customize the layout as per your requirements.
-
Close the Application System-wide View window.
-
-
From the Design Mode In Progress screen, select the Exit Design Mode option.
When your users next log into the SYSPRO Desktop, the newly created system-wide view will be available for them to select.
This is achieved by selecting the Show System-wide View option (SYSPRO Ribbon bar > Home > System-wide View > Show System-wide View). Operators can then change the shape, size or nature of the dashboard as they require.
Process to follow when embedding your dashboard within a program in the SYSPRO Desktop UI:
-
Log into SYSPRO 8 2022 (or later) using the desktop client.
-
Open the program in which you want to embed a dashboard.
If you want to design applications at Role level, then you must be in Design Mode before accessing the required program.
-
Select the Customize icon
, followed by the Design Web View option.Then indicate the section in which you want the dashboard to appear.
A Primary layout is used in this example.
This launches the Visual Designer and displays the current layout if one exists for the program.
-
Select the Add layout section option.
-
From the Configure new layout section screen, select the Embedded Analytics card.
-
From the Select Dashboard section, select Other and then indicate the applicable dashboard you want to embed.
-
Select the Add Section function.
You can add as many layout sections as required and embed multiple visualizations or dashboards.
-
Move the newly added dashboard card to your preferred location and size it according to your requirements.
-
Save the layout.
-
-
Exit the program.
The updated web view will then be available when a user next logs into that program.
Process to follow when embedding your dashboard using the Application Builder program in the SYSPRO Desktop UI:
-
Log into SYSPRO 8 2022 (or later) using the desktop client.
Ensure that you are not currently logged into a role before proceeding.
-
Open the Application Builder program (SYSPRO Ribbon bar > Administration > Customization).
-
Select the Customize icon
, followed by the Design Web View option.If a web view doesn't yet exist, you are prompted to confirm which type of web view you want to create. Select SYSPRO Client to proceed.
-
This launches the Visual Designer and displays the current layout if one exists for the program.
-
Select the Add layout section option.
-
From the Configure new layout section screen, select the Embedded Analytics card.
-
From the Select Dashboard section, select Other and then indicate the applicable dashboard you want to embed.
-
Select the Add Section function.
You can add as many layout sections as required and embed multiple visualizations or dashboards.
-
Move the newly added dashboard card to your preferred location and size it according to your requirements.
-
Save the layout.
-
-
Customize your application as required and save your changes.
-
Exit the program.
When your users next log into the SYSPRO Desktop, the newly built application will be available for them to select.
For an out of the box analytics experience within SYSPRO, the template dashboards offer pre-configured analytics experiences that cater to specific roles within your organization, providing insights into the various aspects of your business.
Not only do these template dashboards provide fully interactive workspaces for specific roles within an organization to engage with, but they also provide examples for learning how to create dashboards for embedding within SYSPRO.
-
Customer Analysis for Accounts Receivable
-
Supplier Analysis for Accounts Payable
-
Cashbook for Treasury Department
-
Finance Manager
-
General Ledger Analysis
-
General Ledger Dimension Analysis
-
Job Status Board
-
Production Capacity Board
-
Production Throughput Analysis
-
Inventory Management Analysis
-
Inventory Management Operations
-
Sales Analysis
-
Sales Orderbook
-
Supplier Performance
-
Supply Chain Analysis
-
Supply Chain Operations
-
WMS
-
System Utilization
Template Utilization
When using any of the template dashboard packs, be aware of the following:
-
The template dashboard packs are zipped files with a seax extension:
-
The naming convention for the Standard Template packs is:
SEA_{short_name}.seax
Where {short_name} indicates the unique name captured as part of the pack's meta data.
-
The standard template dashboard packs (supplied by SYSPRO) are shipped with the product and stored within the \Base\Samples folder.
-
Custom template packs (created by third-party developers) can be stored within the \Work\Analytics folder on the SYSPRO Application server (i.e. you can't export a pack to a client-side folder).
Custom packs are not copied to the \Base\Samples folder.
-
-
Each dashboard pack contains the following:
-
Dashboard configuration file
-
All Business Activity Queries used by the dashboard's visuals
-
Metadata file containing details about the pack
-
PDF document with detailed information pertaining to the dashboard within the pack
Certain dashboards contain specific caveats in their use, which is explained, alongside the key metric definitions for each visualization on the dashboards.
-
-
The Embedded Analytics Import program lets you seamlessly import the templates you require into all companies available within your SYSPRO environment.
Whereas the Embedded Analytics Export program lets you export your dashboards from one SYSPRO instance to another.
-
Imported dashboards are displayed in the Library of the Embedded Analytics Designer program, with the operator that imported the pack listed as the Author for that dashboard. From there you can modify and tailor the dashboard according to your requirements.
SYSPRO takes no responsibility for the use of these template dashboards in an organization for decision-making, reconciliation, and accounting purposes. SYSPRO provides no warranties or support in their use and every organization has unique requirements and caveats that govern their business or accounting, and as such the design of the template, and dashboards may not cater for every need based on your setup rules, configuration options and system setup.
The following indicates areas in the product that may be affected by implementing this feature:
SYSPRO Ribbon bar > Setup
The following options enable you to configure your environment:
(Setup Options > System Setup > Connectivity)
-
Analytics Endpoint
-
Configure
SYSPRO Ribbon bar > Setup > Operators
The following option enables you to define a SYSPRO operator with access rights to the Embedded Analytics Designer program, from where they can design dashboards.
The Embedded Analytics card lets you embed an dashboard within any of the following:
-
SYSPRO Web UI (Avanti):
-
Role-based SYSPRO Workspaces
-
Program web views
-
-
SYSPRO Desktop:
-
Main Menu
-
Program web views
-
Application Builder
-
Application Designer
-
Program List > Embedded Analytics
This program lets you configure your data connections and sources for , as well as design and view browser-based business intelligence dashboards.
Program List > Embedded Analytics
This program lets you import Dashboard packs (both standard and custom types) and all the associated files required to render the dashboard.
Program List > Embedded Analytics
This program lets you create and/or maintain Dashboard Packs for (both standard and custom types) by exporting the required dashboard files.
This migration capability enables you to seamlessly export your dashboard (and all its associated files) from one SYSPRO instance, for importing into another.
(Accessible from the Details function of the Embedded Analytics Export and Embedded Analytics Import programs)
This program lets you view or maintain the meta data associated with a dashboard pack.
The following indicates the business objects that are affected by this feature:
The Query SYSPRO Embedded Analytics Config business object returns the configuration in the Setup Options program.
The Post SYSPRO Embedded Analytics Config business object creates and updates the configuration settings within the Setup Options program.
Copyright © 2024 SYSPRO PTY Ltd.