You use this program to generate suggested stock item minimum/maximum levels through time by applying the policy saved against the stock items.
This program models the effect of the policy and allows you to diagnose potential problems. Various policies may be used to generate 'what-if' scenarios by item/warehouse. You can also view the effect of a policy graphically.
You can adjust the output of modeling by modifying any options in the General or Forecast accuracy groups in the Modeling Options pane.
When the results of modeling are optimal, you may either copy the suggested min/max levels to draft min/max levels or update the current min/max levels for Requirements Planning.
- Toolbar and menu
- Levels Graph
- Modeling Options
- Stock Information
- Warehouse Information
- Stock Modelling
- Notes and warnings
- Hints and tips
| Field | Description |
|---|---|
| Functions | |
| Stock Code Options | Select this to use the Options Maintenance program to maintain the forecasting options to use in the model. |
| Policies | Select this to use the IO Policies program to maintain
policy options to generate the minimum/maximum levels in the
model. This enables you to configure the policy parameters to suit the life-cycle of the SKU you are trying to optimize for minimum/maximum levels. |
| Manual Forecasting | Select this to use the Manual Forecasting program to make changes
to the forecasts. Any changes made to an item in manual forecasting are reflected in the IO Stock Levels Modeling program when you select the forecast base and then the Calculate function. Changes to forecasted demand modify the minimum/maximum levels and related scores for Excess stock, Average stock, etc. |
| Demand History | Select this to use the Demand History Maintenance program to adjust the
sales history (i.e. the demand history) for the forecast.
The results made to the demand history are displayed in the model when you select the Calculate function. |
| Forecast Accuracy | Select this to use the IO Forecast Accuracy Query program to assess the accuracy of previous forecasts. |
| Copy Suggested to Draft | Select this to copy the calculated Suggested
minimum and Suggested maximum
levels to the Draft minimum and
Draft maximum levels. If draft min/max levels already exist for the period(s), then a warning is displayed enabling you to cancel the copy. Draft levels which are frozen are not copied (see Draft levels). |
| Update Current | Select this to set the suggested or draft minimum and
maximum levels to be the current min/max levels which
Requirements Planning must use for its replenishment
calculation. This option takes a snapshot of min/max levels in modeling and copies them to MRP. When you select his option you are prompted to indicate whether you want to copy the suggested levels or the draft levels to current. See Activity considerations in Notes and warnings. MRP uses the current min/max levels when next it runs for stock items with one of the following batching rules (Stock Codes):
Note that when Batch rule Q is set against the stock code, you must define one of the following rules against the warehouse for the stock code.
See also Target service levels in the Notes and warnings section. |
| View | |
| Quantities | Select this to display quantities in the Stock Levels listview. |
| Values | Select this to display cost values in the Stock Levels listview. |
| Selection | |
| Manual | Select this to indicate individual stock items for which you want to run the model. The Warehouse and Stock code fields are enabled when you select this option. |
| Batch | Select this to use the IO Selections program to indicate a selection set or range of stock codes for which you want to run the model. |
| Graph | Indicate the type of graph you want to display in the
Levels Graph pane. You can view a graphical representation of the Suggested min/max levels, or the Draft min/max levels or the Current min/max levels. |
| Warehouse | indicate the warehouse which is being modelled. You can
only enter the warehouse if you selected
Manual at the
Selection menu. If you are running the program in Batch selection mode, then you use the Prev and Next options to navigate to the required warehouse. |
| Stock code | indicate the stock code which is being modelled. You
can only enter the stock code if you selected
Manual at the
Selection menu. If you are running the program in Batch selection mode, then you use the Prev and Next options to navigate to the required stock code. |
| Change Rev/Rel | Select this to enter a different revision/release if the stock item is ECC controlled. |
| Calculate | Select this to re-calculate the model after changes
have been made. The results are displayed in the
Stock Levels listview. The changes are not saved by the Calculate function. They are merely displayed. This enables you to view the 'what-if' impact of the changes you made in the Modeling Options pane. |
This screen is displayed when you select the Update Current option from the Functions menu.
| Field | Description |
|---|---|
| Reference | Optionally enter a reference relating to the copying of the levels to the current levels. |
| Source | |
| Suggested levels | Select this to copy the Suggested min/max levels displayed in the Stock Levels listview to the current min/max levels. |
| Draft levels | Select this to copy the Draft min/max levels displayed in the Stock Levels listview to the current min/max levels. |
| Periods to update | Indicate the periods for which you want to copy the min/max levels to current. This defaults to all periods currently displayed in the Stock Levels listview, but can be changed. |
| Delete draft levels in updated periods | Select this to set the draft min/max levels to zero for the periods you selected to update. |
| Start Processing | Select this to set the suggested or draft minimum and
maximum levels to be the current min/max levels which
Requirements Planning must use for its replenishment
calculation. This takes a snapshot of the selected min/max levels in modeling and copies them to MRP. |
| Close | Select this to return to the previous screen without updating the current levels. |
This displays a graphical representation of the model according to the Graph menu option you selected.
| Field | Description | ||||||||||
|---|---|---|---|---|---|---|---|---|---|---|---|
| General | Apart from the Run date (which defaults to the current system date), the selections in this section default to the selections made in the Inventory Optimization Modeling Setup program. | ||||||||||
| Run date | This is the date when the model will be run. It can be
in the future, past or current. The run date serves as the starting point for the calendar in action. It defaults to the company date, but may be changed. |
||||||||||
| Forecast base | This reflects the selection made at Forecast
to use in demand in the Inventory Optimization Modeling Setup
program.
|
||||||||||
| Apply gross requirements rule | Applies the gross requirements rule defined against the stock item
when calculating the demand for a stock code/warehouse. Sales order demand is used as the basis for the calculation to determine the minimum level required for each period.
|
||||||||||
| Include dependant demand | Select this to include demand created by existing job allocations in calculating the model. This does not include demand from suggested jobs. | ||||||||||
| Apply batching rule |
Select this to apply the batching rule (or order policy) defined against a stock code when calculating the maximum level required for an item. With no policy in place, the model will suggest a minimum of zero and a maximum equal to the total demand. |
||||||||||
| Period days to use | There are several fields in IO modelling which are
based on the number of days in the period.
|
||||||||||
| Forecast accuracy | The selections in this section default to the selections made in the Inventory Optimization Modeling Setup program. | ||||||||||
| Months to compare | Indicate the default number of months to compare for
forecast accuracy (1-12).
|
||||||||||
| Comparison type |
|
||||||||||
| Moving average months | If you set the Comparison type to
Moving average, then you need to enter
the number of months to use for the moving average calculation
of sales history. As with Months to compare, this is converted to periods depending on the calendar in use. |
||||||||||
| Forecast to use | Indicate which forecast to use when comparing against
sales for each period.
|
||||||||||
| Snapshot months |
Indicate the time window, in months, prior to the Run date selected for the Forecast Accuracy review. If the calendar used is in weeks, then all the snapshots that fall within this time window are included. The time window can be anything from 1 to 6 months.
|
||||||||||
| Calculated information | |||||||||||
| Standard deviation | This is the standard deviation calculated for this stock code warehouse. | ||||||||||
| Variance | This is the standard deviation squared. | ||||||||||
| Mean absolute deviation | When there are insufficient data points in the forecast to determine the standard deviation, the mean absolute deviation is used instead. | ||||||||||
| Average hits period | This is useful when doing Poisson-based risk scenarios. | ||||||||||
This pane displays the static stock code information from the Inventory Master table for the stock code under review.
This pane displays the static and dynamic information for the warehouse selected.
![[Note]](images/note.png)
|
|
|
If you run the Requirements Calculation program with consolidated warehouses (Requirements Planning Setup) then the IO dynamic levels are not accounted for. The reason is that the min/max levels (dynamic levels) generated by Inventory Optimization are at stock code/warehouse level - each using different policies and possibly even different calendars for different warehouses. This makes it impossible to amalgamate the levels into a consolidated format. |
|
You can view the material demands for ECC controlled components with WIP allocations against which the Deplete oldest rev/rel first (Component) option (Bill of Materials Setup) is enabled, in the Deplete oldest WIP field.
The modeling information for the currently selected stock item is displayed in three panes namely Stock Levels, Period Details and Draft Levels.
Whenever you make a change in the Information - Modeling Options pane, you need to select the Calculate function to recalculate the stock levels and display the results of your changes. Note that these results are not saved by the Calculate function. They are merely displayed to enable you to view the effect of the changes you made in the Modeling Options.
This listview displays the results of the selected Modeling Options and the impact of the policy under review for the selected stock code/warehouse combination. This information enables you to consider the impact of the policy defined against the stock code/warehouse currently selected.
The values displayed are either the quantities or the cost values depending on your selection in the View menu.
The Functions menu enables you to maintain inputs that affect modeling.
Additional columns can be added to the listview by right clicking in any column heading and selecting the Field Chooser option (see Listviews).
The following information is included in this listview:
| Column | Description | ||||||||||||||||||
|---|---|---|---|---|---|---|---|---|---|---|---|---|---|---|---|---|---|---|---|
| Period |
This indicates the period for which the information is being displayed. Note that the Forecast calendar affects the Period display, how demand is grouped, how suggested min/max levels are derived and the resultant scores. The calendar being used is displayed in the Stock Information pane on the Forecast calendar line. |
||||||||||||||||||
| Existing supply | This is the total of all Work in Progress jobs, Purchase Orders and Goods in Transit. | ||||||||||||||||||
| Sales | This is the demand from sales orders and the supply chain transfers for the supplying warehouse. | ||||||||||||||||||
| Forecast | This is the demand from the Forecast base selected in the Modelling Options pane. | ||||||||||||||||||
| Dependant | This is the demand required to satisfy component requirements in jobs (i.e. all outstanding demand from Work in Progress jobs). | ||||||||||||||||||
| Total demand |
If the Gross Requirements Rule is not used, then demand is always the forecast quantity for the period. If you apply the Gross requirements rule then it works in exactly the same way as within Requirements planning:
The dependent demand is always added to the demand if it is included irrespective of the Gross Requirements rule. Note that if the demand time fence is not set against the stock code, then Sales are used for all periods. If you want to see the total demand for the item for the period as Sales + Forecast + Dependant, then you need to select A as the Gross requirements rule for the stock code and set the demand time fence to be non-zero. |
||||||||||||||||||
| Projected available |
Projected available = Opening stock in the first period. For subsequent periods, this is calculated as: Opening stock + Existing supply - Total demand |
||||||||||||||||||
| Suggested minimum | This is calculated based on the policy settings (IO Policies) for the stock code/warehouse, the historical sales demand and the forecast accuracy. | ||||||||||||||||||
| Suggested maximum |
This is calculated as follows
|
||||||||||||||||||
| Average stock | This is calculated as: (Suggested minimum + Suggested maximum) / 2 | ||||||||||||||||||
| Target turns |
This is calculated as follows:
|
||||||||||||||||||
| Suggested supply | This indicates how much is needed to meet the maximum level depending on the Batching rule for the item and the policy settings. It is based on the shortage, where the shortage is the Opening stock + supply - demand. | ||||||||||||||||||
| Draft minimum and Draft maximum |
These are the draft minimum and maximum levels you are currently working with. These can be modified manually (see Draft levels) or they can be copied from the Suggested min/max levels using the Copy Suggested to Draft option from the Functions menu). These levels can only be maintained when the company date is later than or equal to the period start date of the calendar used. |
||||||||||||||||||
| Current minimum and Current maximum | These are the min/max levels which will currently be used by the Requirements Calculation to derive an optimal requirement. | ||||||||||||||||||
| Excess stock | This is calculated as: Projected available - Suggested maximum | ||||||||||||||||||
| Average stock | This is calculated as: Suggested minimum + (Suggested maximum - Suggested minimum) / 2 | ||||||||||||||||||
| Days cover | This is calculated as: Days cover = average stock / (forecast in period / days in the period or month) | ||||||||||||||||||
| Actual turns |
This is calculated as follows:
|
||||||||||||||||||
| Exception |
This column displays any exception messages related to the suggested min/max levels calculated. The following messages are included:
|
This pane displays the target service level and related information for the stock item, per period. These are the details captured against the IO Policy for the stock code (see IO Policies). You can amend the policy using the Functions - Policies option.
IO policies can extend to any period of time into the future. A different policy can be defined for each period, or season, or for changes in sales according to the product life cycle of the item. Each period therefore should be supported by the appropriate policy relevant to the season the item is in.
Note that the Forecast calendar (see IO Stock Levels Modeling) affects the period display, how demand is grouped, suggested derived min/max levels and the resultant scores.
This pane displays the current draft min/max levels and enables you to manually adjust these levels and to freeze them if required.
Draft forecasts can only be maintained when the company date is later than or equal to the period start date of the calendar used.
| Field | Description |
|---|---|
| Save | Select this to save your changed. |
| Period | This is the period for which the draft min/max levels are being displayed. |
| Period start | This is the start date of the period. |
| Period end | This is the end date of the period. |
| Minimum | Indicate the minimum draft level you
require. The number of decimals for the minimum level cannot exceed the specified number of decimals defined against the stock code. This value cannot be negative. |
| Maximum | Indicate the maximum draft level you
require. This cannot be less than the minimum level. The number of decimals for the maximum level cannot exceed the specified number of decimals defined against the stock code. |
| Freeze | Select this to freeze the min/max draft levels for
the line at their current levels. Frozen draft levels are not overwritten when you select to Copy Suggested to Draft from the Functions menu. |
-
The Target Service Level – defined against the policy (IO Policies) – is crucial in determining the resultant min/max levels.
The higher the Target Service Level, the higher the suggested Minimum, and by implication, the higher the suggested Maximum. These min/max levels are used by the MRP calculation to address demand, in conjunction with Batching Rules set against the Inventory Master.
It follows therefore that, the higher the Target Service Level, the higher the potential inventory on-hand, and the greater the risk you bear when customers do not purchase your product in the volumes recommended by the Target Service Level.
Suggested min/max levels must be critically reviewed for feasibility in relation to the target service level set, before they are copied to current for use in MRP. It is recommended that only senior staff are involved in the determination of min/max levels, since this is the level at which decisions affecting profitability are made.
-
Changes made in this program can have a major impact on Requirements Planning and Forecast Optimization and therefore only senior staff should have access to its functions.
-
The IO Stock Levels Modeling program does not read values from a proxy. Stock modelling is based on forecast accuracy.
If there is no forecast accuracy calculated (i.e. it is zero) then there is no value that can be used in the min/max levels calculated going forward. If you have a new stock item, then a risk policy (which requires the forecast accuracy) cannot be applied until such time as history is built up that will allow it to be calculated. You cannot use a risk based policy until you have at least one month's history to calculate forecast accuracy. Initially, a fixed policy may be used until some history has built up.
Electronic Signatures provide security access, transaction logging and event triggering. This enables you to increase control over your system changes.
Access to the following eSignature transactions within this program can be restricted at Operator, Group, Role or Company level. You configure this using the eSignature Setup program.
| eSignature Transaction | Description |
|---|---|
| IO Copy suggested levels to draft |
Controls access to the Copy Suggested to Draft function in the IO Stock Levels Modeling program. |
| IO Update current levels |
Controls access to the Update Current function in the IO Stock Levels Modeling program. |
| IO Maintain draft levels |
Controls access to the maintenance of draft levels in the IO Stock Levels Modeling program. |
Operator access to the following activities within this program can be restricted. You configure this using the Operators program.
| Activity | Description |
|---|---|
| IO Allow update of current forecasts | Controls whether an operator can update current (live) Inventory forecasts using the Batch Forecasting, IO Stock Levels Modeling and Manual Forecasting programs. This also affects the Target for results options that can be selected in the IO Selection Sets program. |
Inserting Application Help
You would typically follow this procedure to display help for the current program in a customized pane that can be pinned to the program window.
Information includes step-by-step instructions for the various functions available within the program, including a brief overview of what the program does, what setup options are required and how to personalize the program.
-
Open the program for which you want to insert application help into a customized pane.
This functionality is only available for a program that has panes.
-
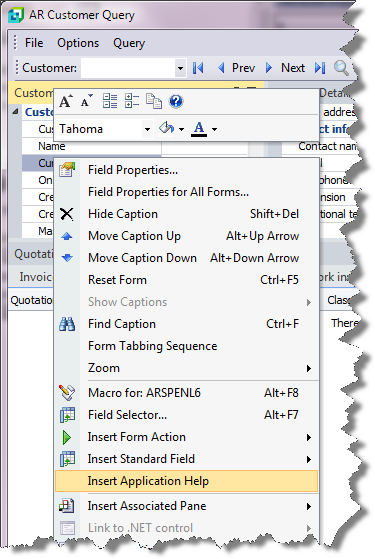
Right-click any form field.
You can also click the triangle menu icon that appears in the title area of a pane.
-
Select Insert Application Help from the context-sensitive menu.
The application help appears in a pane within your program. You can reposition the pane using the docking stickers or pin it to the program window.
Removing the Application Help pane
If you no longer want to display application help in a pane for your current program, you can simply remove it.
-
Select the Close icon in the right-hand corner of the application help pane.

-
Confirm that you want to delete the pane.