You use this program to measure the accuracy of forecasts by stock code/warehouse, selection set and Families and Groupings collection. Forecast accuracy should be run by exception, rather than for all stock items on file.
This review enables you to measure and compare your historical forecasts against your actual sales movements, including lost sales.
Identifying forecast accuracy enables you to better manage the risk of inaccurate forecasting.
The output of this program is also used in Inventory Optimization as a factor when calculating safety stock over time.
When new forecasts are approved and moved across into the MRP Forecast table for use in the rest of SYSPRO, a snapshot of these new forecasts is written into a forecast snapshot table.
This is important in the ability to measure forecast accuracy, as you cannot measure the current forecasts against historical sales history for an item which has any kind of lead time. You need to compare the sales history on the forecast which was raised in the period where the lead time falls.
The forecast review takes these snapshots and compares them both against each other and against the actual sales history which forecasting uses to generate future forecasts.
- IO Forecast Accuracy Review
- Selections
- Summary
- Group Information
- SKU Information
- Details
- Period Information
- Hints and tips
- Notes and warnings
When you load the Forecast Accuracy Review program, the IO Selections program is displayed, enabling you to indicate the stock items for which you want to measure forecast accuracy.
When you select the Start Processing option from the IO Selections program, the results are displayed on the IO Forecast Accuracy Review screen.
| Field | Description |
|---|---|
| View | Indicate the Selections
information you want to display in the
Summary and Details
panes. One of the following can be selected:
Some components in the Selections treeview cannot be viewed in Quantities (e.g. Buyer and Planner). |
| Parameters | Select this to load the IO Selections program to indicate the selection set or stock code/warehouse selections for which you want to run the forecast accuracy review. |
This treeview enables you to select the categories or levels of forecast accuracy you want to review.
Your selection in the treeview determines what is displayed in the Summary and Details panes.
An entry of {Unclassified} indicates that the information is not saved in the Inventory Master file/table. For example all selected stock items that do not have the buyer defined against them are listed in the unclassified section for Buyers in the treeview.
Pareto analysis need to be run before any entries are listed in the Pareto classifications entry (see Pareto Analysis).
Selecting the All SKUs entry displays the forecast accuracy for all stock items in the selected selection set or all stock items you selected to include in the IO Selections program.
This displays the details for the entry currently selected in the Selections treeview.
The values displayed depend on your selection in the View menu.
| Column | Description |
|---|---|
| Forecast | This indicates the forecast value for the forecast used. |
| Sales | This indicates the actual sales value used to compare against the forecast value. |
| Hits | This indicates the number of actual sales. |
| CFE |
Cumulative forecast error. This is the difference between the forecast and the actual sale(s) for the period under review, displayed cumulatively. A positive number indicates a forecast that is too high for a period and a negative number indicates a forecast which is too low for the period. |
| MAD |
Mean Absolute Deviation. The is the average absolute deviation from the mean (i.e. the average error, ignoring the sign of the error). |
| MSD |
Mean square deviation. This is the sum of the squared forecast errors for each observation divided by the number of observations. It is an alternative to the Mean Absolute Deviation except that, because the errors are squared, more weight is placed on larger errors. |
| MAPE |
Mean Absolute Percentage Error. This is calculated as the average of the sum of all the absolute percentage errors for the data set. The absolute values of the percentages are summed and the average is computed. The difference between actual value and the forecast value is divided by the actual value. The absolute value of this calculation is summed for every forecast point in time and divided again by the number of fitted points. |
| Tracking signal |
This is calculated as the algebraic sum of forecast errors divided by the Mean Absolute Deviation. It indicates whether the forecast average is keeping pace with any genuine upward or downward changes in demand. |
This pane is available when you select any parent item in the in the Selections treeview. For example when you click on Selection totals, Buyers, Suppliers, Warehouses, etc.
Details of the group of stock keeping units (SKU) or of the actual SKU currently highlighted in the Summary listview are displayed. These details can also be displayed in the Summary listview.
This pane is available when you select any item below a parent item in the Selections treeview. For example when you click on {Unclassified} under Buyers or Suppliers, on a specific warehouse under Warehouses, on a specific planner under Planners, etc.
Details of the stock keeping unit (SKU) currently highlighted in the Summary listview are displayed. These details can also be displayed in the Summary listview.
This pane consists of two tab pages, namely Forecast vs Sales and Period Breakdown.
This displays a graphical representation of the comparison between the forecast and the actual sales movements for the entry selected in the Selections treeview.
The graph is displayed according to the options you defined for your graphs within SYSPRO.
This listview displays the values per period for the corresponding entry currently highlighted in the Summary listview.
These values displayed depend on your selection in the View menu.
| Column | Description |
|---|---|
| Absolute error |
This indicates the forecast error as a positive value. For example, if the forecast quantity is 100 and the sales quantity is 120, then the forecast error would be (100 - 120) = (-20), but the absolute error would be 20. |
| Status |
This indicates whether forecast is over or under the sales value. If the forecast value is more than the sales value then the status is Over (i.e. you have over forecast). Conversely, if the forecast value is less than the sales value, then the status is Under (i.e. you have under forecast). |
| Error % | This is the forecast error expressed as a percentage of sales. It is calculated as ((Forecast - Sales)/Forecast ) * 100. |
| Accuracy % | This is calculated as (100 - Error %). |
| Absolute error % | This is the absolute error expressed as a percentage of sales. It is calculated as (Absolute error / Sales) * 100. |
| Forecast Error | This is the difference between the Forecast value and the Sales value. |
| From date and To date | These indicate the opening and closing dates of the selected period. |
| MAPE2 |
This indicates the absolute value of the Mean Absolute Percentage Error. This is calculated as the absolute value of ((Sales - Forecast) / Forecast) * 100. |
| Absolute CFE |
This indicates the absolute value of the Cumulative Forecast Error. This is calculated as the absolute value of ((Sales - Forecast) / Sales) * 100. |
This displays the same information as in the Period Breakdown listview, but only for the period currently highlighted in that listview.
-
This program displays the results on screen only, but you can use the Forecast Accuracy program to generate the same information in a report format.
To calculate forecast accuracy, actual sales must be compared against the relevant forecasts as they are created for stock code/warehouse combinations. The following programs create snapshots of live forecasts as they are created:
-
Batch Forecasting
-
Manual Forecasting
-
Families and Groupings (when disaggregation is applied and live forecasts are created for SKUs)
-
Approve Draft Forecasts
![[Note]](images/note.png)
|
|
|
|
Inserting Application Help
You would typically follow this procedure to display help for the current program in a customized pane that can be pinned to the program window.
Information includes step-by-step instructions for the various functions available within the program, including a brief overview of what the program does, what setup options are required and how to personalize the program.
-
Open the program for which you want to insert application help into a customized pane.
This functionality is only available for a program that has panes.
-
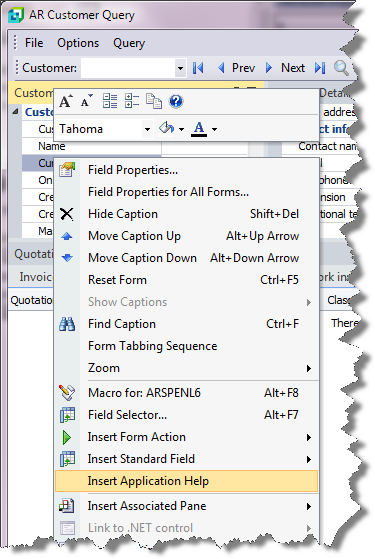
Right-click any form field.
You can also click the triangle menu icon that appears in the title area of a pane.
-
Select Insert Application Help from the context-sensitive menu.
The application help appears in a pane within your program. You can reposition the pane using the docking stickers or pin it to the program window.
Removing the Application Help pane
If you no longer want to display application help in a pane for your current program, you can simply remove it.
-
Select the Close icon in the right-hand corner of the application help pane.

-
Confirm that you want to delete the pane.