You use this program to analyze and classify inventory items according to their contribution towards the total in terms of sales, gross profit, cost, quantity or transactions (hits). This enables you to identify those items that should be better managed because of their impact on the company's profitability.
- IO Pareto Analysis Parameters
- Toolbar and menu
- Parameters
- Level Totals
- Pareto Graph
- Pareto Summary
- Pareto Results
- Notes and warnings
When you load the Pareto Analysis program, the IO Selections program is displayed, enabling you to indicate the stock items you want to analyze and to tailor the analysis
These options must be defined before the analysis results can be displayed.
This screen displays the result of the analysis according to your selections in the IO Selections program.
| Field | Description | ||||
|---|---|---|---|---|---|
| Options | |||||
| Parameters | Select this to use the IO Selections program to indicate the parameters to use to perform the analysis. | ||||
| Functions | |||||
| Manual Forecasting | Select this to use the Manual Forecasting program to manually generate forecasts for items on an individual basis. | ||||
| Demand History | Select this to use the Demand History Maintenance program to view the sales history accumulated into the forecasting periods as defined by the calendar in use. | ||||
| Parameters | Select this to use the IO Selections program to indicate the parameters to use to perform the analysis. | ||||
| Save Results |
Save the stock code classifications that were analyzed. This allows other forecasting programs to use this information, enabling you to include/exclude items based on the classification.
|
||||
| Group | This applies only if the analysis was run at a Level
other than stock code (IO Selections). The description for this field changes according to the analysis level you selected. This can be one of the following:
Enter the next group (warehouse, product class, supplier, planner or buyer) for which you want to display the analysis details. |
||||
| Prev | Select this to view the previous group of results.
This option is available only if the analysis was run at a level other than stock code. |
||||
| Next | Select this to view the next group of results.
This option is available only if the analysis was run at a level other than stock code. |
||||
The parameters that were used to perform the analysis are displayed in this pane (see IO Selections).
This indicates the level totals for the currently selected group.
![[Note]](images/note.png)
|
|
|
|
| Column | Description |
|---|---|
| Current group |
This indicates the group for which the analysis is currently being displayed. 'All" indicates that the Analysis level is Stock code. For all other analysis levels, this indicates the code of the warehouse, product class, supplier, planner, or buyer for which the analysis is currently being displayed. |
| Number of hits | This indicates the group number of individual transactions. |
| Quantity | This indicates the group quantity sold/forecast in the stocking unit of measure. |
| Cost |
This indicates the group cost value of sales/forecasts. Forecast cost values are calculated using the forecast quantity and the current warehouse cost. See Field considerations in Notes and warnings. |
| Sales value | This indicates the group sales value of sales/forecasts. Forecast sales values are calculated using the forecast quantity and the current list price. |
| Profit | This indicates the group profit of sales/forecasts. |
| On hand value | This indicates the on hand value of the stock codes in the group at the current warehouse cost. |
| Total items | This indicates the total number of items included in the calculation. |
| Analysis period | This displays the review period's start and end dates. |
This listview displays details of the stock items included in the analysis.
The totals for selected columns are displayed at the bottom of the listview.
These totals may differ from the totals displayed in the Level Totals pane. The reason for this is that the totals in the Level Totals pane include values for items that are not necessarily listed in the listview. For example, you may have excluded 'E' class items, but these items may have values against them.
Additional columns can be added right clicking in any listview column heading and selecting the Field Chooser option.
| Column | Description |
|---|---|
| Stock code | This displays the stock item to which the analysis relates. |
| Description | This displays the description for the stock item. |
| ABC | This shows the A, B, C or D classification as defined by the percentage breaks. |
| ABC % | This shows the percentage contribution for each item of the total. |
| Cum ABC % |
This indicates the cumulative percentage of the total of all preceding stock codes plus this one. The classification of stock codes is based on this cumulative percentage figure. A stock code is assigned the highest class towards which it contributes. Therefore, the preceding line's cumulative percentage is compared to the percentage breaks (as defined in the parameters) to determine the class for the current stock code. |
| Hits | This indicates the number of individual transactions against the stock code. |
| Quantity | This indicates the quantity sold/forecast in the stocking unit of measure. |
| Uom | This indicates the quantity sold/forecast unit of measure. |
| Sales Value | This indicates the sales value of sales/forecasts.
Forecast sales values are calculated using the forecast
quantity and the current list price. For Kit type and Sub type items, the sales value is zero for the Parent item. The Parent is merely the grouping that determines what was sold of the components. |
| Cost |
This indicates the cost value of sales/forecasts. Forecast cost values are calculated using the forecast quantity and the current warehouse cost. For Kit type and Sub type items, the cost value is zero for the Parent item, as the costs are held against the Components of the kit. The components need to be forecast and classified for Pareto (not the parent) as it is the components that update Iop-Transactions. See Field considerations in Notes and warnings. |
| Profit | This indicates the profit of sales/forecasts, calculated as Sales value less Cost. |
| On hand Value | This indicates the on hand value of the stock codes at the current warehouse cost. |
| On hand % | This indicates the on hand value of the stock code as a percentage of the total on hand value. |
| Product class | This displays the product class defined against the stock item. |
| Revision |
This indicates the revision level for the item, if the item is defined as ECC controlled (Stock Codes). This applies only if the option: Analyze by Rev/Rel is enabled on the parameters screen. |
| Release |
This indicates the release level for the item, if the item is defined as ECC controlled (Stock Codes). This applies only if the option: Analyze by Rev/Rel is enabled on the parameters screen. |
| Last ABC | This indicates the previous saved classification for the stock code at the level analyzed. |
| Last date | This indicates the date the stock code was last analyzed (and saved) at this level. |
| Supplier | This indicates the supplier assigned to the stock item. |
| Buyer | This indicates the buyer assigned to the stock item. |
| Planner | This indicates the planner assigned to the stock item. |
| On hand quantity | This indicates the quantity on hand in the warehouse. |
| Average sales | This is calculated as the (Total sales / Number of months). |
| Months cover | This is calculated as (On hand / Average monthly unit sales). |
| Rank | This indicates the sequential number of each record in the ranking. |
| Rank % | This is calculated as ((100 x (Rank divided by Total number of items)). |
- Current month sales are excluded from the Pareto Analysis.
- Items defined as Phantom part and Notional part (Stock Codes) are excluded from the Pareto Analysis.
-
If the option: Update sales history automatically is enabled (Inventory Optimization - General Setup) then updates to the forecast history for sales and sales returns take place automatically for the stock code/warehouse combinations you process.
Operator access to the following fields within this program can be restricted. You configure this using the Security Fields function of the Operators program.
| Field | Description | ||||
|---|---|---|---|---|---|
| INV Show costs in Inventory/WIP queries |
Controls whether stock item costs are displayed in the Inventory, Work in Progress, Projects and Contracts and Inventory Planning modules. It also controls whether cost values are printed on the Stock Take Variance report and the unit cost for bought out items is printed on the Advanced Trial Kitting (Legacy) report.
|
||||
Inserting Application Help
You would typically follow this procedure to display help for the current program in a customized pane that can be pinned to the program window.
Information includes step-by-step instructions for the various functions available within the program, including a brief overview of what the program does, what setup options are required and how to personalize the program.
-
Open the program for which you want to insert application help into a customized pane.
This functionality is only available for a program that has panes.
-
Right-click any form field.
You can also click the triangle menu icon that appears in the title area of a pane.
-
Select Insert Application Help from the context-sensitive menu.
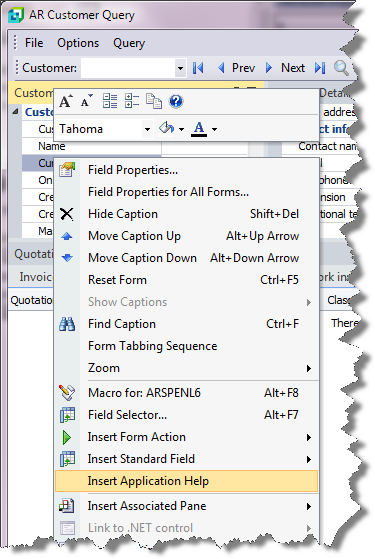
The application help appears in a pane within your program. You can reposition the pane using the docking stickers or pin it to the program window.
Removing the Application Help pane
If you no longer want to display application help in a pane for your current program, you can simply remove it.
-
Select the Close icon in the right-hand corner of the application help pane.

-
Confirm that you want to delete the pane.