You use this program to calculate and review the actual service level achieved for one or more stock items against the target service level defined in the policy for the item(s).
The actual service level is calculated based on invoiced sales and is measured against the required service level you indicated against each of the policies (e.g. line fill rate). See IO Policies.
The information for the service level review is taken from the IO Sales Order Performance table, which is updated each time you print an invoice for a stocked merchandise sales order line. When multiple deliveries are invoiced for a sales order line, an entry is added to this table for each delivery, together with a summary line indicating the total number of deliveries made for the item.
You can use the Initial History Creation program to take on sales performance information into the IO Sales Order Performance table based on the invoice reprint tables.
When you load the Service Level Review program, the IO Selections program is displayed, enabling you to indicate the stock items for which you want to run the service level review.
When you select the Start Processing option from the IO Selections program, the results are displayed on the IO Service level Review screen.
| Field | Description |
|---|---|
| View | |
| Cost Values | Select this to display cost values in the Details listview. |
| Sales Values | Select this to display sales values in the Details listview. |
| Quantities | Select this to display quantities in the Details listview. |
| Aggregated Service Levels | Indicate the measure to use to calculate the aggregated service levels. |
| Line fill rate | This is the default selection and compares your target
service level to your actual achieved service level. This is the Quantity Invoiced as a percentage of the Quantity Ordered and is calculated as: Line fill rate = Quantity Invoiced / Quantity Ordered * 100 for the order line. |
| Line on time in full |
Order line delivered in full on or before the Line Due Date (customer request date). This is calculated as: Line on time in full = Lines in full / (Order lines + Number of lost sales) * 100. An order line in full is when the quantity shipped is not less than the quantity ordered and the last line ship date is not later than the customer request date. |
| Line on time |
Order line delivered on or before the Line Due Date (customer request date). This may or may not be a full delivery. This is calculated as: Line on time = Lines on time / (Order lines + No lost sales) * 100. An order line on time is when a quantity has been shipped on or before the customer request date. It is not necessarily complete by the request date. |
| Order fill rate | This is the total Quantity Delivered (or Invoiced) as a percentage of the total Quantity Ordered for all of the stocked merchandise lines within a single Sales Order. This is calculated as: Order fill rate = Value shipped / (Value ordered + Value of lost sales) * 100.The Order fill rate is always calculated using the sales value. |
| Order on time in full | All lines on the order are delivered on or before the line Due Date (Customer Request Date) and each line is delivered in full. This is calculated as: Orders on time in full = Orders in full / (No Orders + No lost sales) * 100. An order is seen as on time in full when all the order lines included in the review have been shipped in full on or before the customer request date. |
| Order on time |
All lines on the order are delivered on or before the line Due Date (Customer Request Date). This is calculated as: Orders on time = Order on time / (Number of orders + Number of lost sales) * 100. An order on time is an order where all the order lines included in the review have at least partial shipments made on or before each customer request date. Order based measures only take into account the order lines which are included in the review based on the selections made. For example, if you have an order with 3 stocked merchandise lines: A100, B100 and X999. If your selection is only for A100 and B100, then the third line for X999 is not included in any of the measures. |
| Parameters | Select this to use the IO Selections program to indicate the stock items for which you want to run the service level review. |
This treeview enables you to select the categories or levels for which you want to display service level information in the review.
Your selection in the treeview determines what is displayed in the Summary and Details panes.
An entry of {Unclassified} indicates that the information is not saved in the Inventory Master file/table. For example all selected stock items that do not have the buyer defined against them are listed in the unclassified section for Buyers in the treeview.
Pareto analysis need to be run before any entries are listed in the Pareto classifications entry (see Pareto Analysis).
Selecting the All SKUs entry displays the service levels for all stock items in the selected selection set or all stock items you selected to include in the IO Selections program.
This displays the service level totals for the entry currently selected in the Selections treeview.
The values displayed are the sales values, cost values or quantities depending on your selection in the View menu.
Additional columns can be added to the listview by right clicking in any column heading and selecting the Field Chooser option.
| Column | Description | |||||||||||||||
|---|---|---|---|---|---|---|---|---|---|---|---|---|---|---|---|---|
| Target shortfall | This is calculated as: Target Shortfall = Ordered - (Ordered * Target Service Level/100) | |||||||||||||||
| Actual shortfall | This is calculated as: Actual Shortfall = Ordered - (Ordered * (Actual Service Level / 100)) | |||||||||||||||
| Target level % |
The order-based service levels (Order on time in full and Order on time) are averaged by the number of SKU lines on the individual sales order when deriving the Target Level %. The target level % is then calculated as: Ratio / total number of contributing orders * 100 The more often a stock item appears on a sales order, the higher its weighting will be when deriving the ratio. For example, if you have the following sales orders:
The aggregated ratio is calculated as: ((4 *0.80) + (0 * 0.85) + (2 * 0.9) + (1 * 0.95)) = 3.2 + 0 + 1.8 + 0.95 = 5.95 Total contributing sales orders are: 4 + 0 + 2 + 1 = 7 The Target service level will then be: 5.95 / 7 * 100 = 85% |
This pane consists of three tab pages, namely Sales Graph, Sales Orders and Period Breakdowns.
This displays a graphical representation of the service level information for the line currently highlighted in the Summary listview.
The sales values, cost values or quantities are plotted, depending on your selection in the View menu.
This listview displays the sales orders which make up the number of sales orders (i.e. No. orders) for the line currently highlighted in the Summary listview.
This listview displays the values per period for the corresponding entry currently highlighted in the Summary listview.
These values are the sales values, cost values or quantities depending on your selection in the View menu.
Additional columns can be added to the listview by right clicking in any column heading and selecting the Field Chooser option.
This pane is available when you select any item below a parent item in the Selections treeview. For example when you click on {Unclassified} under Buyers or Suppliers, on a specific warehouse under Warehouses, on a specific planner under Planners, etc.
Details of the stock keeping unit (SKU) currently highlighted in the Summary listview are displayed. These details can also be displayed in the Summary listview.
This pane is available when you select any parent item in the in the Selections treeview. For example when you click on Selection totals, Buyers, Suppliers, Warehouses, etc.
Details of the group of stock keeping units (SKU) or of the actual SKU currently highlighted in the Summary listview are displayed. These details can also be displayed in the Summary listview.
Inserting Application Help
You would typically follow this procedure to display help for the current program in a customized pane that can be pinned to the program window.
Information includes step-by-step instructions for the various functions available within the program, including a brief overview of what the program does, what setup options are required and how to personalize the program.
-
Open the program for which you want to insert application help into a customized pane.
This functionality is only available for a program that has panes.
-
Right-click any form field.
You can also click the triangle menu icon that appears in the title area of a pane.
-
Select Insert Application Help from the context-sensitive menu.
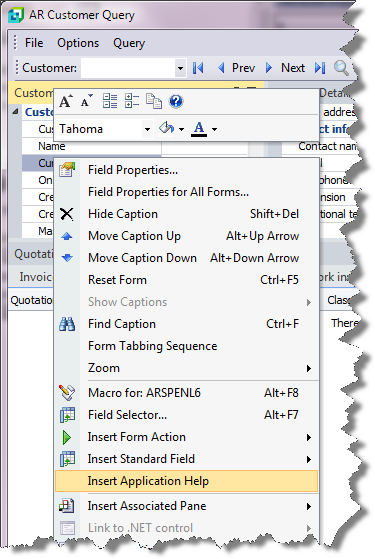
The application help appears in a pane within your program. You can reposition the pane using the docking stickers or pin it to the program window.
Removing the Application Help pane
If you no longer want to display application help in a pane for your current program, you can simply remove it.
-
Select the Close icon in the right-hand corner of the application help pane.

-
Confirm that you want to delete the pane.